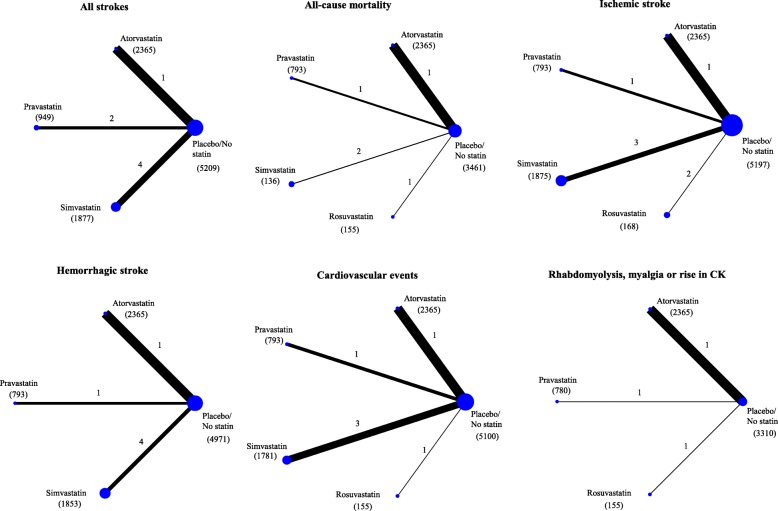
Fig. 3.
Network plots of evidence for primary and secondary outcomes: each line links the treatments that have been directly compared in studies. The thickness of the line is proportional to the precision of each direct estimate, and the width of each circle is proportional to the number of studies included in the treatment. The number of studies per comparison is reported next to each line, and the number of patients included in each treatment is reported in the bracket below the treatment name

