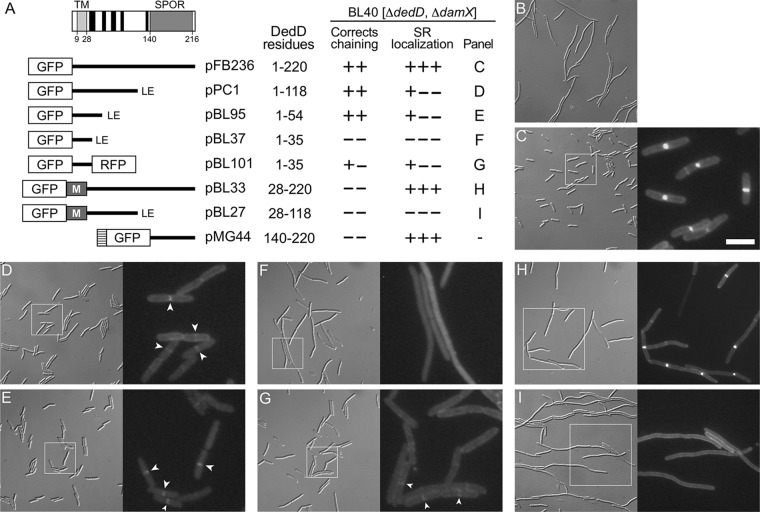
FIG 1.
Domain analyses of E. coli DedD. (A) Schematic depiction of full-length DedD (DedD1–220). The transmembrane domain (TMDedD) and the C-terminal SPOR domain (SDedD) are indicated. Potential α-helices (H1 to H5), predicted to form in the periplasmic portion between TMDedD and SDedD by the GOR IV secondary-structure prediction method (85), are indicated in black. Also shown are inserts present on plasmids that encode fusions of various portions of DedD to GFP or TTGFP under control of the lac regulatory region. The TTGFP fusion encoded by pMG44 contains the TorA signal peptide (hatched box) that is cleaved upon export to the periplasm via the twin arginine transport (Tat) system. M represents residues 2 to 39 of MalF, which include cytoplasmic residues and the first transmembrane domain (TM1; MalF19–35) of the protein (88). Some fusions end with a nonnative Leu-Glu dipeptide (LE), as indicated. The table on the right shows (left to right) the DedD residues present in each fusion; whether the fusion could fully (++) or partially (+−) or could not (−−) correct the cell-chaining phenotype of BL40 [ΔdamX ΔdedD]; whether the fusion accumulated sharply (+++), weakly (+−−), or not at all (−−−) at division sites in the strain; and the panel with corresponding cell images. (B to I) Images of live BL40 [ΔdamX ΔdedD] cells carrying the vector control pMLB1113ΔH [Plac::] (B), pFB236 [Plac::gfp-dedD] (C), pPC1 [Plac::gfp-dedD1–118] (D), pBL95 [Plac::gfp-dedD1–54] (E), pBL37 [Plac::gfp-dedD1–35] (F), pBL101 [Plac::gfp-dedD1–35-rfp] (G), pBL33 [Plac::gfp-malF2–39-dedD28–220] (H), or pBL27 [Plac::gfp-malF2–39-dedD28–118] (I). Panels C to I comprise a differential interference contrast (DIC) image (left) and a fluorescence (FL) image (right) that corresponds to the boxed area in the DIC image. Bar, 16 μm (all DIC images), 8 μm (FL images in panels H and I), or 4 μm (FL images in panels C to G). Cells were grown for ∼5 mass doublings to an OD600 of 0.5 to 0.6 in LB with 50 μM IPTG. Strong septal localization of TTGFP-DedD140–220 was shown previously (71) and resembled that seen in panel H. Examples of weak (GFP-DedD1–118 and GFP-DedD1–54) or very weak (GFP-DedD1–35-RFP) septal accumulations of some of the SPOR-less fusions are marked by arrowheads in panels D, E, and G.

