
FIG 5.
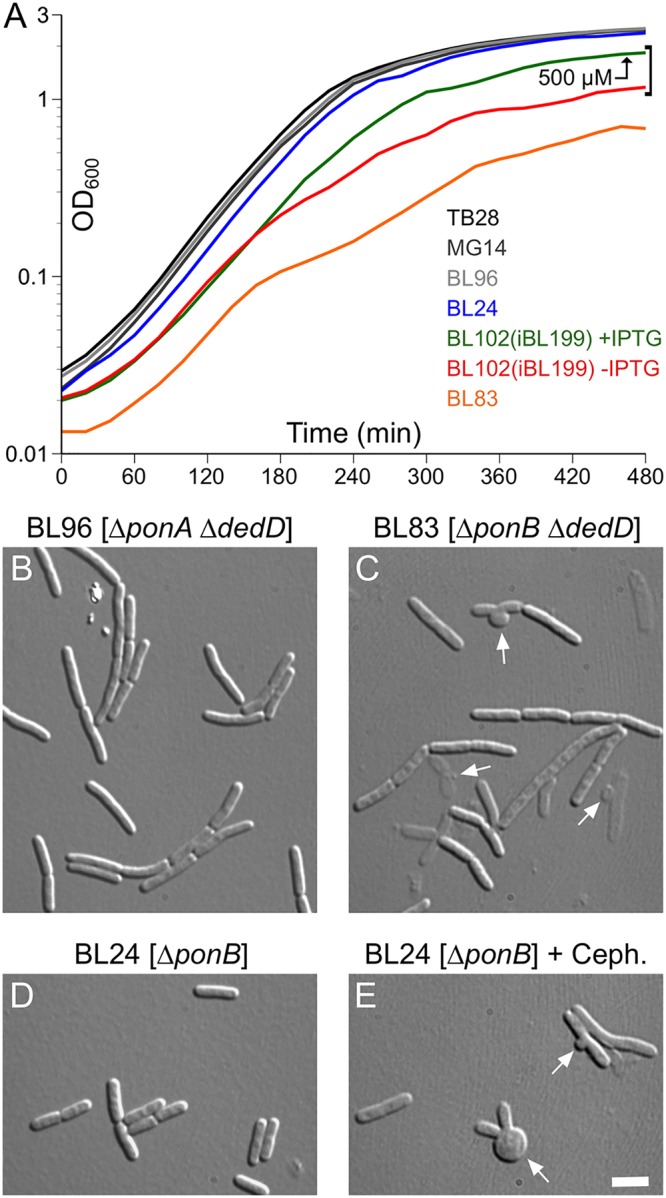
Absence of both DedD and PBP1B causes severe cell lysis. (A) Growth curves of strains TB28 [wt] (black), MG14 [ΔdedD] (dark gray), BL96 [ΔponA ΔdedD] (light gray), BL24 [ΔponB] (blue), BL83 [ΔponB ΔdedD] (orange), and the DedD depletion strain BL102(iBL199) [ΔponB ΔdedD(Plac::gfp-dedD1–54)] (red and green). Cultures were grown overnight in LB with 500 μM IPTG [BL102(iBL199)], or without inducer (all other strains) and diluted 200-fold in LB with 500 μM IPTG (green) or without inducer (all other curves). Growth was continued, and OD600 values were determined every 20 min. Note that the TB28, MG14, BL96, and BL24 curves almost coincide. The shape of the orange curve reflects the relatively low densities attained by overnight cultures of strain BL83 [ΔponB ΔdedD], a relatively long lag period, and a decrease in the rate of optical density increase around 160 min. (B to E) Strains BL96 [ΔponA ΔdedD] (B), BL83 [ΔponB ΔdedD] (C), and BL24 [ΔponB] (D and E) were cultured in parallel as in panel A, and the cells were imaged 3 h (B and D) (OD600, ∼0.6) or 5 h (C) (OD600, ∼0.3) after inoculation. When the culture in panel E reached an OD600 of 0.3, cephalexin was added to 15 μg/ml, and the cells were imaged 30 min later. The arrows in panels C and E indicate examples of septal bulges and rabbit ears, indicative of septal lysis. Bar, 4 μm.