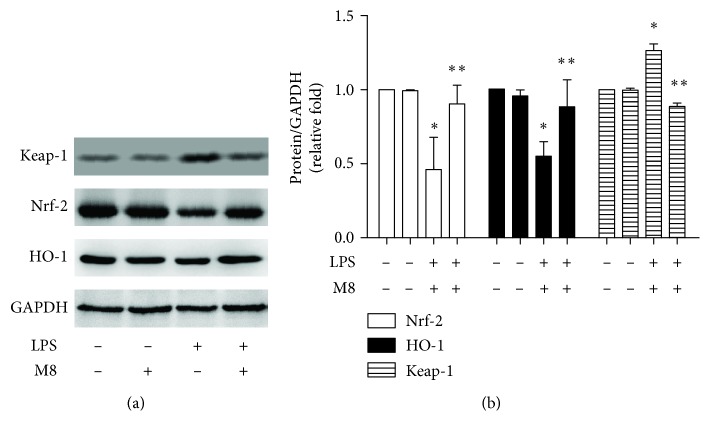
Figure 5.
MFG-E8 reversed LPS-induced downregulation of Nrf-2/HO-1. (a) Representative western blot images of Nrf-2, HO-1, and GAPDH. (b) Quantitative analysis of each group was conducted. Fold changes of Nrf-2 (white bar) and HO-1 (black bar) expression were shown. Data were expressed as the mean ± SD (n = 3). ∗ P < 0.05 versus the Control group; ∗∗ P < 0.05 versus the LPS group. Con: Control; M8: MFG-E8.

