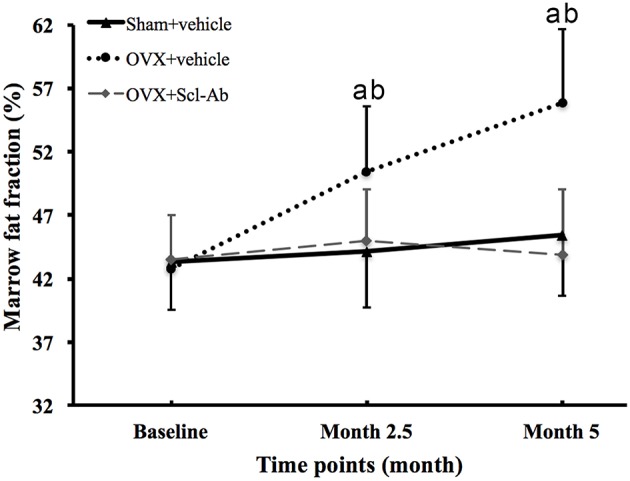
Figure 3.

Changes in marrow fat fraction at the femur in all groups at all time points. Data are expressed as mean ± SD. OVX, ovariectomy; Scl-Ab, sclerostin antibody; Sham, sham-operation. aP < 0.001 vs. previous time point in OVX + vehicle group. bP < 0.01 vs. Sham + vehicle and OVX + Scl-Ab groups at the same time point.
