
FIGURE 2.
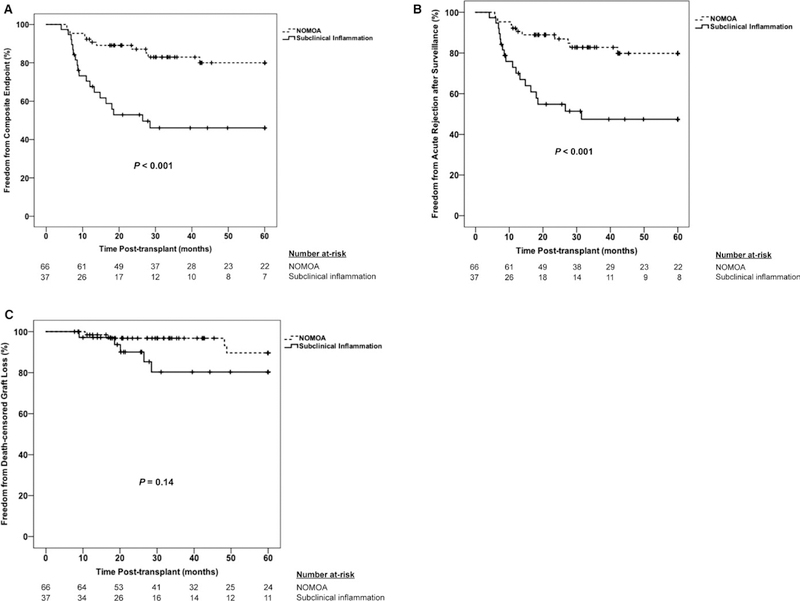
Kaplan-Meier plot of 5-year incidence of primary (A) and secondary (B, C) outcomes between the subclinical inflammation and no major abnormalities groups. (A) Composite endpoint of acute rejection after surveillance and death-censored graft loss. (B) Acute rejection after surveillance component of the composite endpoint. (C) Death-censored graft loss component of the composite endpoint. Comparisons of time-to-event data between groups were made using the log-rank test. NOMOA, no major abnormalities