
Figure 2.
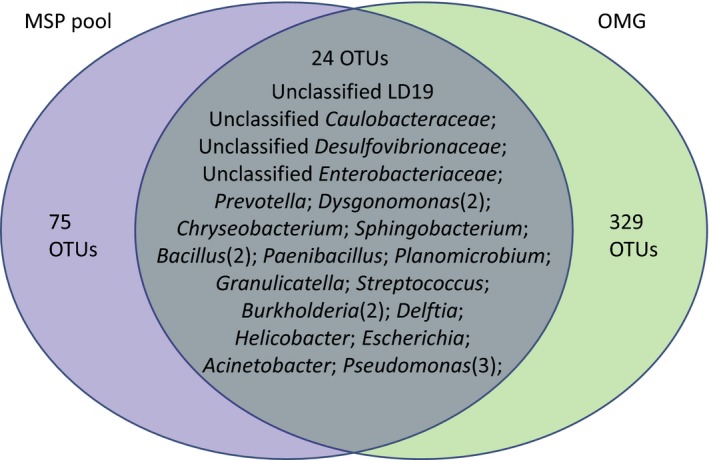
Venn diagram of OTUs in the two samples. Unique and shared OTUs in the two samples are based on 97% similarity. The numbers inside the diagram indicate the numbers of OTUs
Official websites use .gov
A
.gov website belongs to an official
government organization in the United States.
Secure .gov websites use HTTPS
A lock (
) or https:// means you've safely
connected to the .gov website. Share sensitive
information only on official, secure websites.
Venn diagram of OTUs in the two samples. Unique and shared OTUs in the two samples are based on 97% similarity. The numbers inside the diagram indicate the numbers of OTUs