
Figure 1.
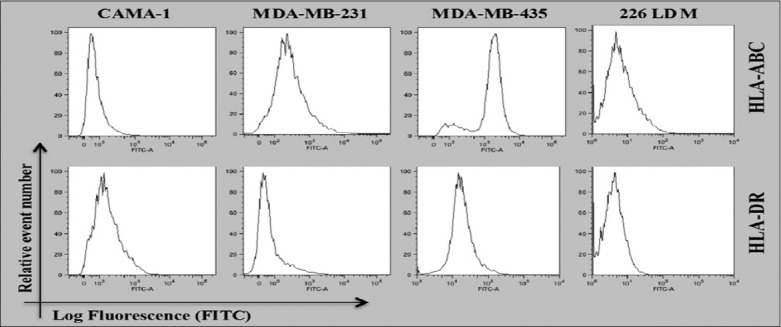
Flow cytometric analysis for cell surface expression of HLA-A, B, and C and HLA-DR in the cells displayed. The data shown are the representative of three independent expressions
Official websites use .gov
A
.gov website belongs to an official
government organization in the United States.
Secure .gov websites use HTTPS
A lock (
) or https:// means you've safely
connected to the .gov website. Share sensitive
information only on official, secure websites.
Flow cytometric analysis for cell surface expression of HLA-A, B, and C and HLA-DR in the cells displayed. The data shown are the representative of three independent expressions