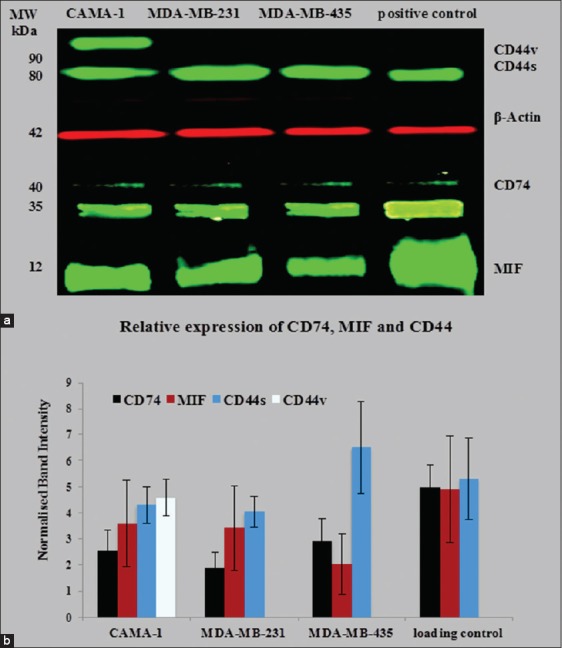
Figure 3.

Semi-quantitative western blot for cluster of differentiation (CD) 74, macrophage migration inhibitory factor (MIF), and CD44 in CAMA-1, 3,4-methylenedioxyamphetamine (MDA)-MB-231, and MDA-MB-435 cells (a); normalized band intensities of CD74, CD44, and MIF with β-actin were plotted. Each bar represents protein expression in mean ± standard deviation of five independent scanned (b). The data are the representative of three independent assays
