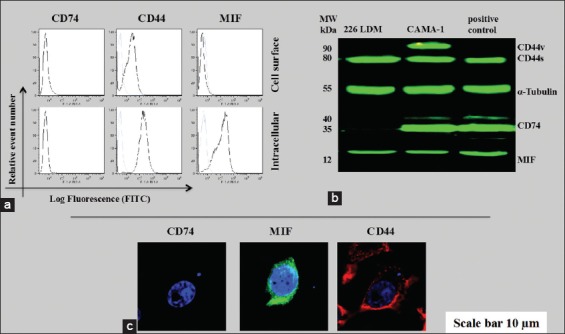
Figure 5.

The cluster of differentiation (CD) 74, macrophage migration inhibitory factor (MIF), and CD44 protein expression in 226LDM cells. (a) Cell surface and intracellular expression of CD74, MIF, and CD44. Empty histograms are shown for 226LDM cells stained with indicated antibody. Blue-filled histograms are shown for negative controls obtained from an isotype matched with control antibody. (b) Western immunoblot for CD74, MIF, and CD44. (c) Confocal laser scanning for intracellular staining of CD74, MIF, and CD44 in 226LDM cells. The data are the representative of three independent assays
