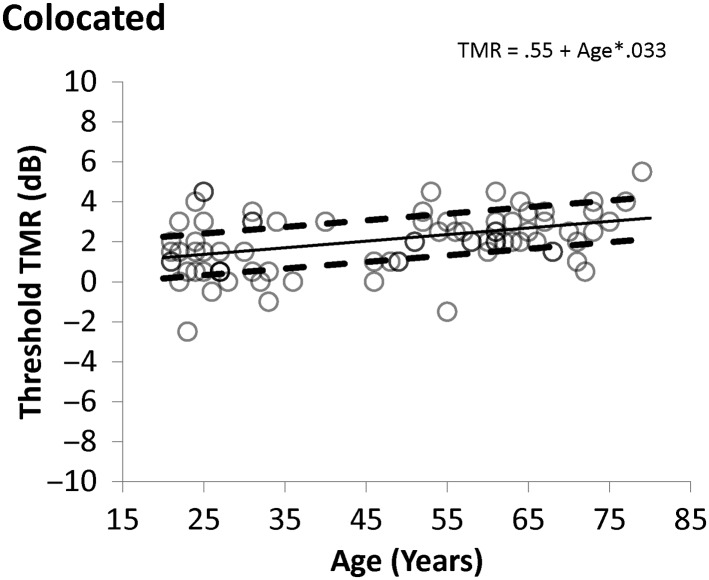
Figure 2.
Colocated thresholds as a function of age. The values predicted for the normative function are shown as the solid line and individual thresholds are shown as unfilled circles. Dashed lines indicate the values 1 SD away from the predictive function, as defined by the error of the model in predicting the individual data. TMR = target-to-masker ratio.

