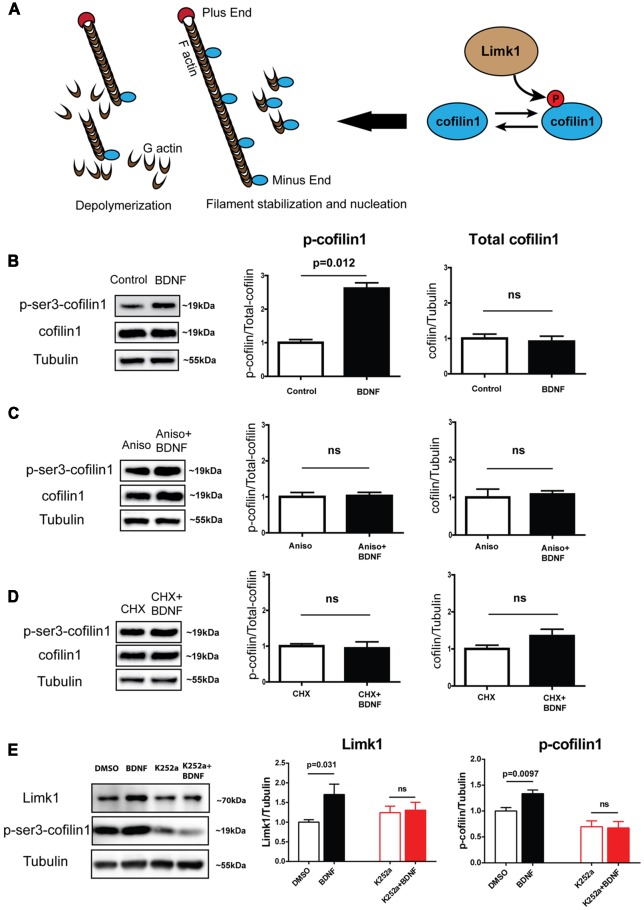
Figure 2.
BDNF leads to increase in phosphorylation of cofilin1 in a protein synthesis-dependent manner. (A) Schematic showing Limk1 and cofilin1 function. (B) Representative immunoblots (Left) and quantification of phosphorylated (Center) and total cofilin (Right) from DIV 5 cortical neurons with BDNF treatment for 1 h. (C) Representative immunoblots (Left) and quantification of phosphorylated (Center) and total cofilin (Right) from DIV 5 cortical neurons with BDNF treatment for 1 h in the presence of 40 μM anisomycin. (D) Representative immunoblots (Left) and quantification of phosphorylated (Center) and total cofilin (Right) from DIV 5 cortical neurons with BDNF treatment for 1 h in the presence of 100 μM CHX. (E) Representative immunoblots (Left) and quantification of Limk1 (Center) and phosphorylated cofilin (Right) from DIV 5 cortical neurons with BDNF treatment for 1 h in the presence of 200 nM K252a (n = 3–5, Unpaired Student’s t-test, mean ± SEM), ns, not significant.

