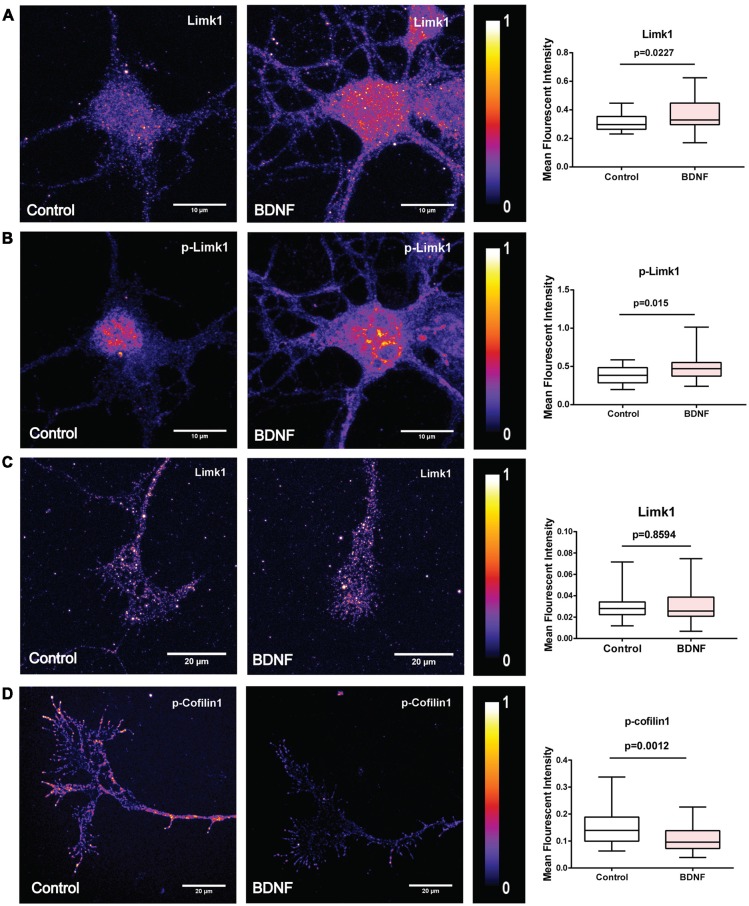
Figure 4.
BDNF leads to increased Limk1 levels in the cell body. In the axonal growth cones BDNF did not affect Limk1 levels, but reduced phosphorylation of cofilin1. (A) Representative heat map images of control (Left) and BDNF treated (Center) cortical neurons immunostained for Limk1. Right panel shows the quantification of the signal from the cell body. (B) Representative heat map images of control (Left) and BDNF treated (Center) cortical neurons immunostained for p-Limk1. Right panel shows the quantification of the signal from the cell body. (C) Representative heat map images of axonal growth-cones from control (Left) and BDNF treated (Center) cortical neurons immunostained for Limk1. Right panel shows the quantification of the signal. (D) Representative heat map images of axonal growth-cones from control (Left) and BDNF treated (Center) cortical neurons immunostained for p-cofilin1. Right panel shows the quantification of the signal (n = 30–36 neurons from three independent experiments. Box and whisker plots show median, first and third quartiles with error bars representing the minimum and maximum data points. Mann-Whitney test).

