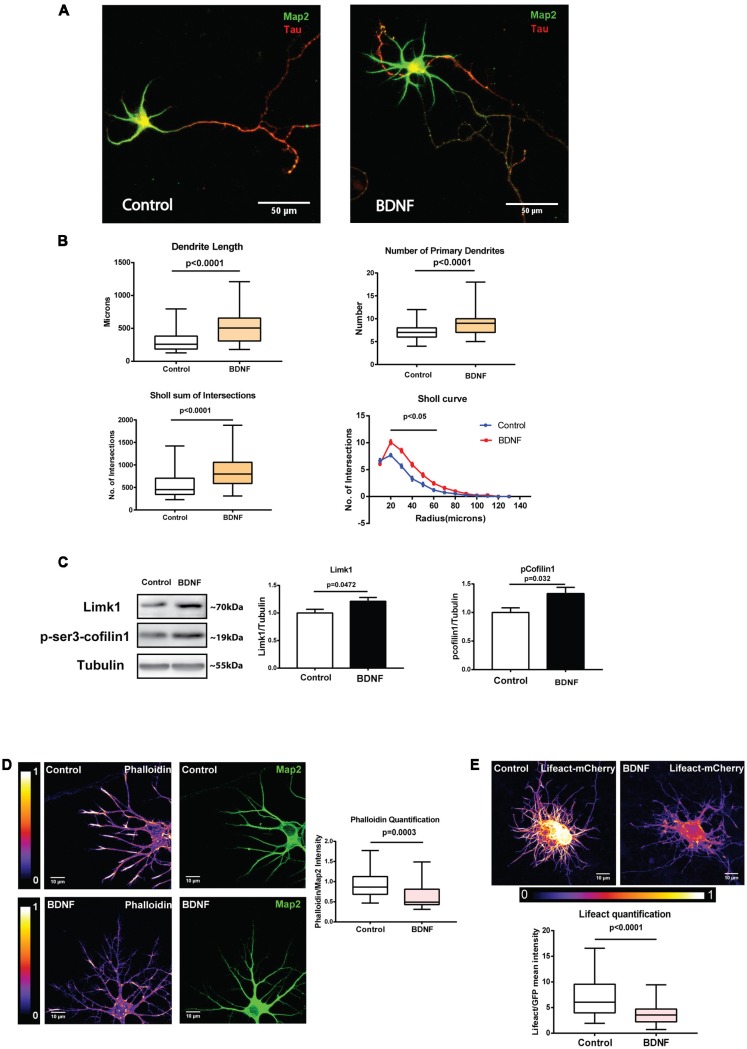
Figure 6.
BDNF-induced Limk1 synthesis is sustained for 48 h and is associated with dissolution of F-actin and dendritic growth. (A) Representative images of neurons treated with or without 50 ng/ml BDNF for 48 h, fixed and immunostained for microtubule-associated protein2 (Map2; Green) and Tau (Red). (B) Quantification of total dendritic length (Top Left), number of primary dendrites (Top Right) total intersections by Sholl analysis (Bottom Left) and Sholl curves (Bottom Right) from control and BDNF treated cortical neurons from the experiment described in Figure 6A (n = 49–61 neurons across three independent experiments, Box and whisker plots show median, first and third quartiles with error bars representing minimum and maximum data points, Mann Whitney test). (C) Representative immunoblots (Left) and quantification of Limk1 (Center) and p-cofilin1 (Right) levels from control or 48 h BDNF treated cortical neurons (n = 7, Unpaired Student’s t-test, mean ± SEM). (D) Representative images (Left) and quantification (Center) of phalloidin from neurons treated with or without 50 ng/ml BDNF for 48 h. Mean intensity of phalloidin normalized to Map2 (n = 23 neurons from two independent experiments, Mann Whitney test). (E) Representative images (Top) and quantification of F-actin (Bottom) from neurons treated with or without 50 ng/ml BDNF for 48 h (Right) transfected with Lifeact-mCherry. Mean intensity of mCherry normalized to EGFP (n = 49–50 neurons from three independent experiments, Mann-Whitney test).

