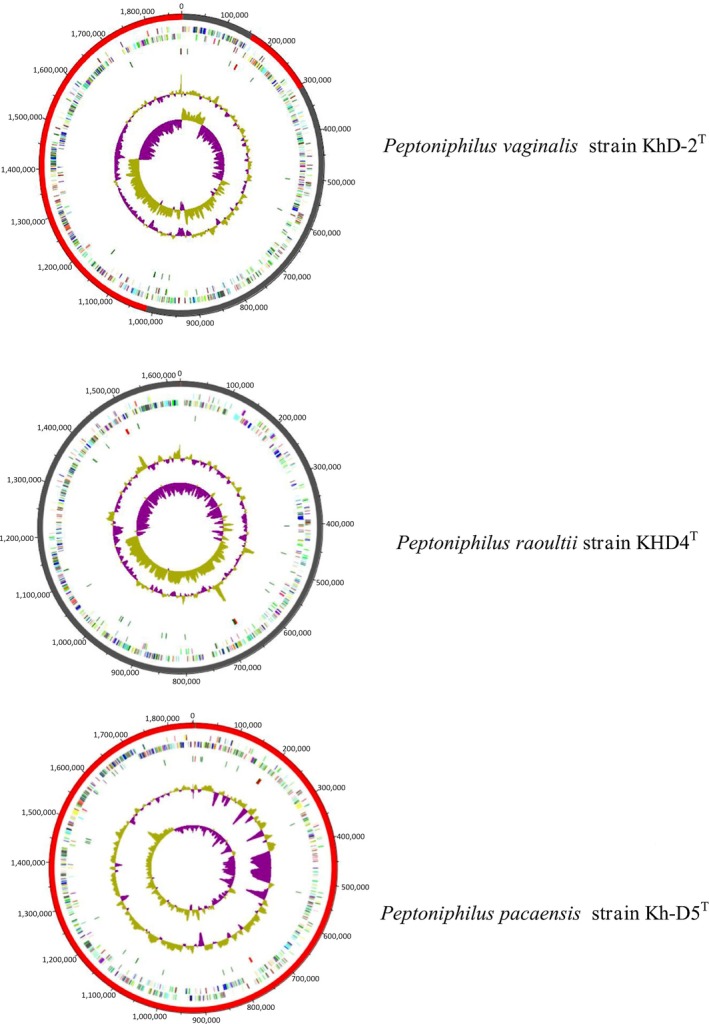
Figure 3.

Graphical circular map of the three genomes. From outside to the center: Contigs (red/gray), COG category of genes on the forward strand (three circles), genes on forward strand (blue circle), genes on the reverse strand (red circle), COG category on the reverse strand (three circles), G+C content
