. 2017 Dec 1;1(3):159–168. doi: 10.1162/OPMI_a_00016

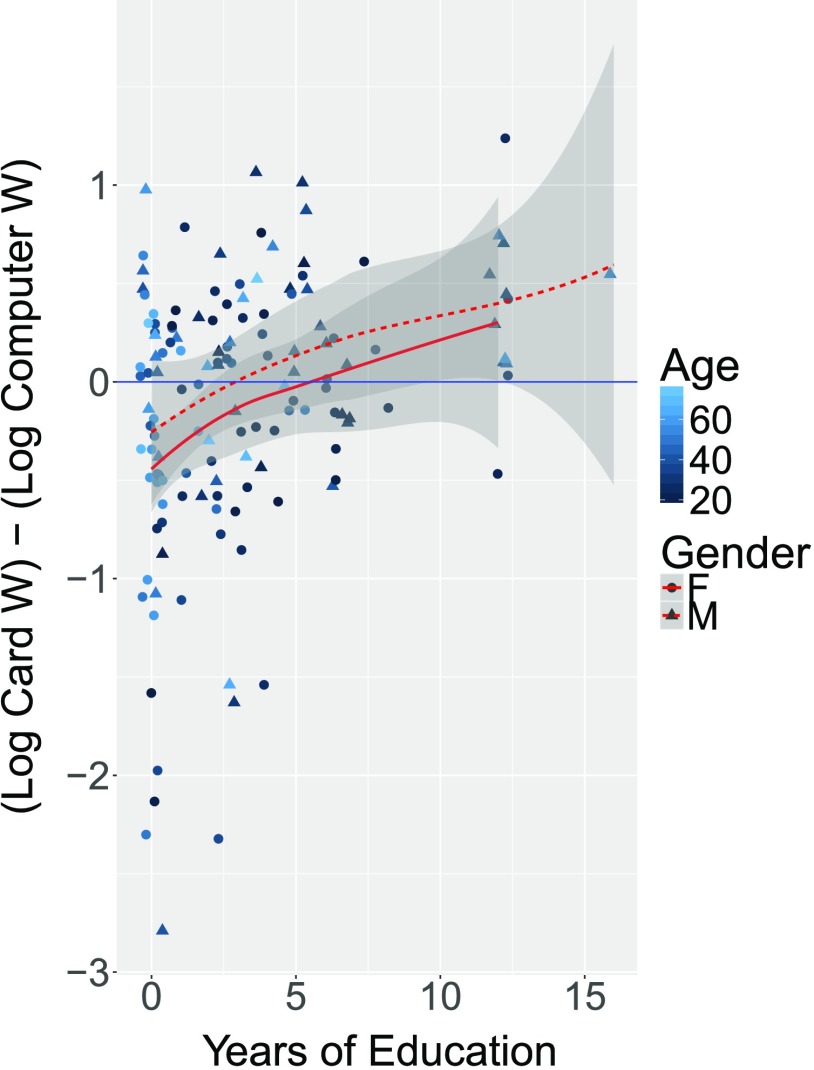
Figure 3. . Difference score (Log Cards W minus Log Computer W) as a function of education for males and females separately (which don’t differ significantly). A smoothed nonparametric fit (loess) is shown for each, with 95% confidence bands. This figure demonstrates that for low education, Log Card W is less than Log Computer W (negative values on this plot), meaning that participants perform less well on computer tasks. However, the positive trend of the red average line indicates that the effect disappears and potentially reverses for high education. In addition, this figure reveals no obvious trends with respect to age and the difference score, but one can see that high-education participants tend to be younger and male, reflecting current Tsimane’ demographics.

Figure 3.