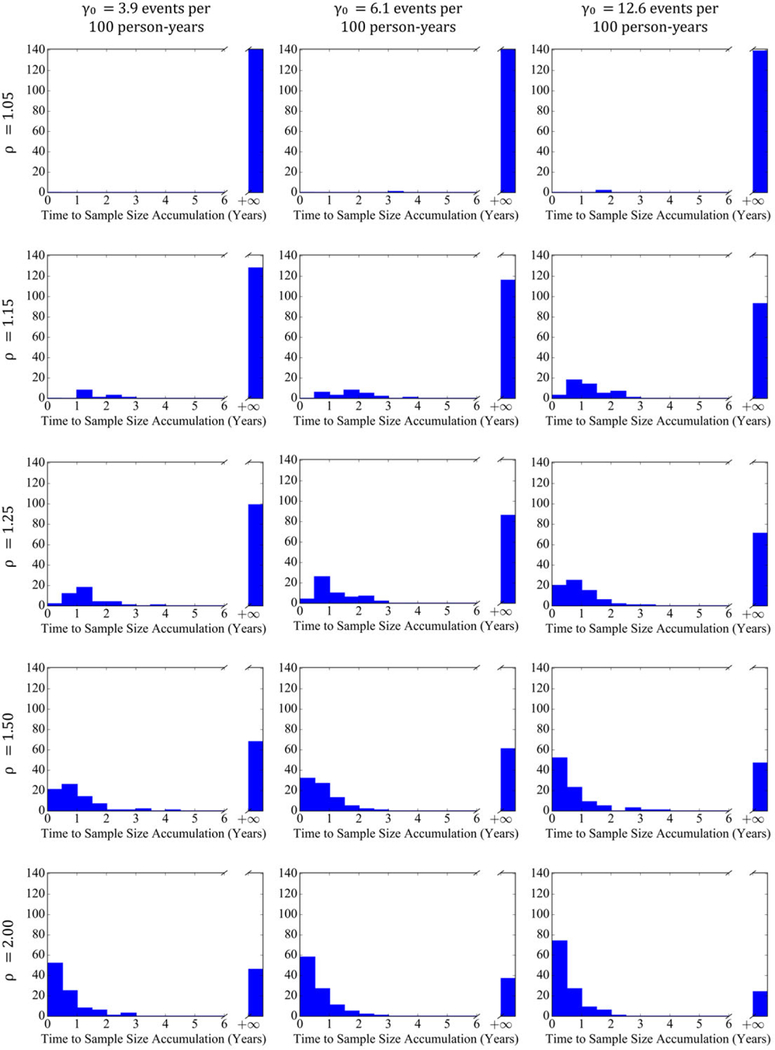
FIGURE 4.

Histograms of time to sufficient accrued utilization in years to detect safety differences for implantable cardioverter defibrillators across adverse event and complication rates of 3.9, 6.1, and 12.6 events per 100 person‐years and rate ratios of 1.05, 1.15, 1.25, 1.50, and 2.00 for significance level α=0.05 [Colour figure can be viewed at wileyonlinelibrary.com]
