Figure 5.
Quantification of protein expressions in immune cells in the T1D pancreas.
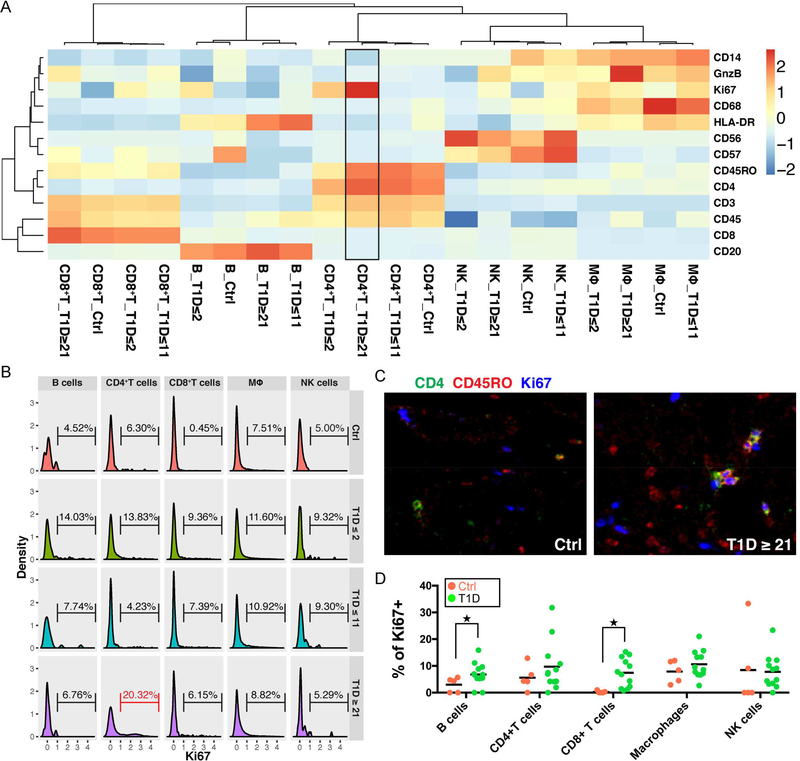
(A) Heatmap demonstrates that immune cells from different donors cluster by cell type and display canonical marker expression. CD4+T cells from patients with long duration diabetes (T1D≥2) have high Ki67 level (black box). Input data are mean levels of each protein in each cell type for each donor type. Values associated with each row of the heatmap are centered and standardized separately. Heatmap color indicates Z-score.
(B) Percentage of Ki67+ cells in each cell type of different donor groups. CD4+T cells from T1D≥21 donors have the highest percentage of Ki67+ cells (red bracket). Ki67 values from each immune cell type for each donor type are used as input.
(C) Proliferating CD4+T cells in the long duration diabetes donor (T1D≥21) display a memory phenotype. Displayed channels are: CD4 (green); CD45RO (red) and Ki67 (blue). All panels are shown at 5× magnification.
(D) Quantification of percentage of proliferating cells in control and T1D donors. B cells and CD8+T cells show increased proliferation compared with controls. Each dot represents one donor. ★Indicates statistical significance based on Mann-Whitney test with p ≤ 0.05.

