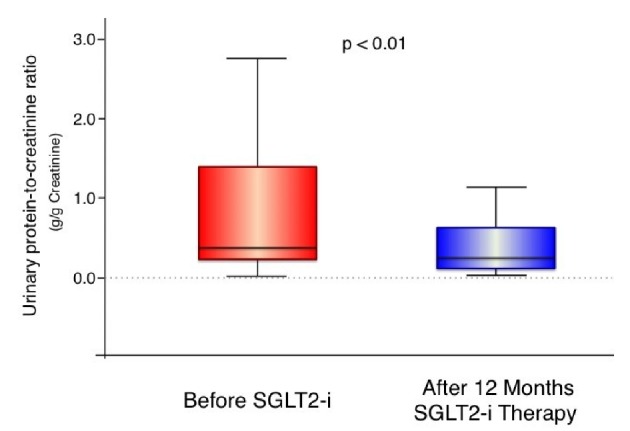
Figure 1.

Urinary protein excretion (urinary protein-to-creatinine ratio) before and after 1-year treatment with sodium glucose cotransporter 2 inhibitors. In the box-and-whisker plots, lines within boxes represent median values; the top and bottom lines of the boxes represent the 25th and 75th percentiles, respectively; the top and bottom bars outside the boxes represent the 90th and 10th percentiles, respectively. N = 35, SGLT2i: sodium glucose cotransporter 2 inhibitor.
