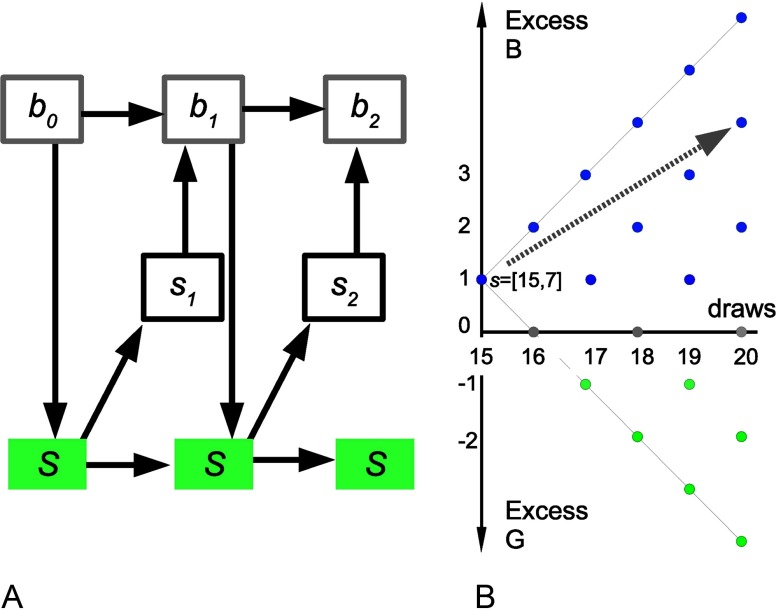
Figure 2. .
State space schematic. A) Markovian transitions in this task. Top: belief (probabilistic) component of states; middle: observable part of the state (data/feedback). Down arrows: actions (sample, declare). Bottom: true state. For example, let the cost of sampling be very high. Then b0 may be “equiprobable lakes,” Action 1 “sample,” s1 “B,” b1 “60% B,” Action 2 “declare B,” and s1 “Wrong.” B) In this example, sampling cost is very low. A person has drawn 15 fishes, 7 of them g, hence the position of 15 on the x-axis and +1 on the y-axis as there is a +1 excess of black fish so far. The visible states corresponding to all possible future draws are shown. Looking ahead (example: gray arrow), the agent finds the “sampling” action more valuable in that the current preference for the B lake is likely to be strengthened at very low cost.

