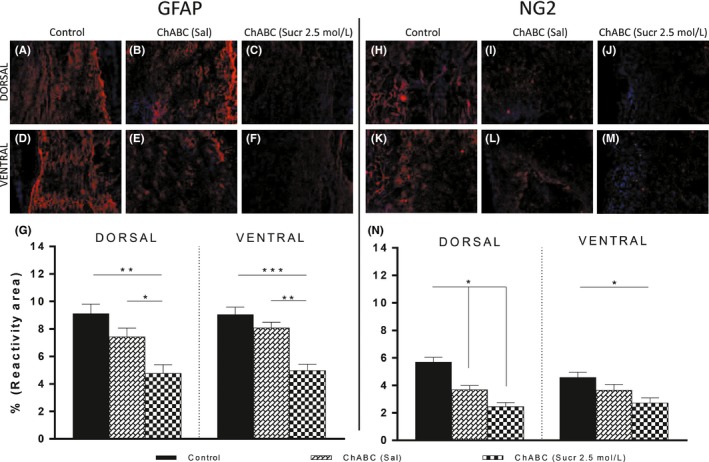
Figure 4.

Morphological analysis of gliosis. GFAP and NG2 reactivities were decreased in treated group. Images showing immunofluorescence sections of injured spinal cord stained for GFAP (A, F blue = DAPI, red = GFAP) and NG2 (H, M blue = DAPI, red = NG2). These are representative images taken from longitudinal sections. A‐J, Images showing dorsal sections; D‐M, Images showing ventral sections. Scale bars represent 100 μm. N, Results suggest gliosis reactive to GFAP and NG2 was significantly decreased in ChABC (Sucr 2.5 mol/L) if compared to control and ChABC (Sal) groups. (P**<.01 dorsal control vs dorsal treated and P*<.05 dorsal ChABC (Sal) vs dorsal treated; P***<.001 GFAP ventral control vs ventral treated and P**<.01 ventral ChABC (Sal) vs ChABC (Sucr 2.5 mol/L); P*<.05 NG2 dorsal control and dorsal ChABC (Sal) vs NG2 dorsal treated; P*<.05 ventral control vs ventral treated)
