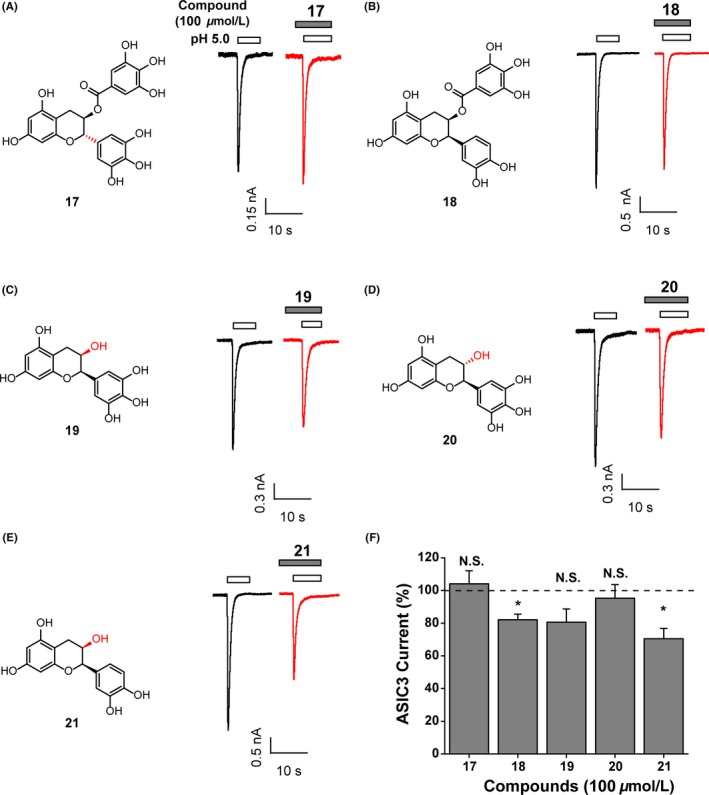
Figure 3.

Structure–activity relationship of compound 11 derivatives. (A‐E) (Left) Chemical structures of compound 11 derivatives. (Right) Representative current traces showing the inhibition of pH 5.0‐activated currents from ASIC3 expressing CHO cells induced by compounds as indicated. Every compound was used at the concentration of 100 μmol/L. (F) Pooled data. Data points are means ± S.E.M. of 3‐6 measurements. N.S., not significant difference, *P < 0.05, compared with 100% (dashed line), paired Student's t test
