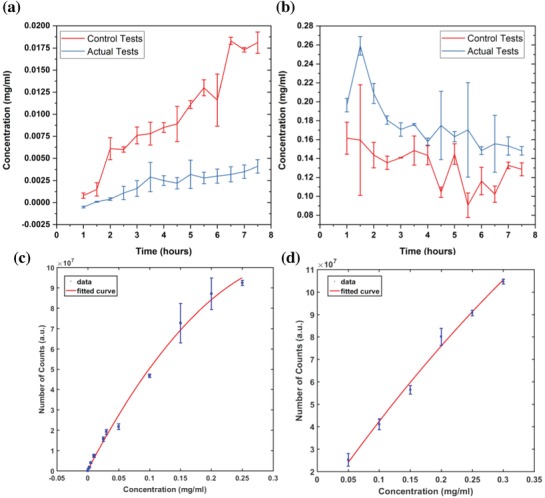
Figure 3.

Caffeine concentrations calculated for both the maternal and fetal sides. a) EGM (fetal side). b) F‐12K (maternal side). Actual tests have both HUVECs and BeWo cells on the chip and the control has solely the bare membrane with media perfusing through the channels. c) Calibration curve for caffeine concentrations in EGM (concentrations ranging from 0.00001 to 0.25 mg mL−1). d) Calibration curve for caffeine concentrations in F‐12K (concentrations ranging from 0.05 to 0.3 mg mL−1). n = 3 independent experiments. Data were presented as mean (±SD).
