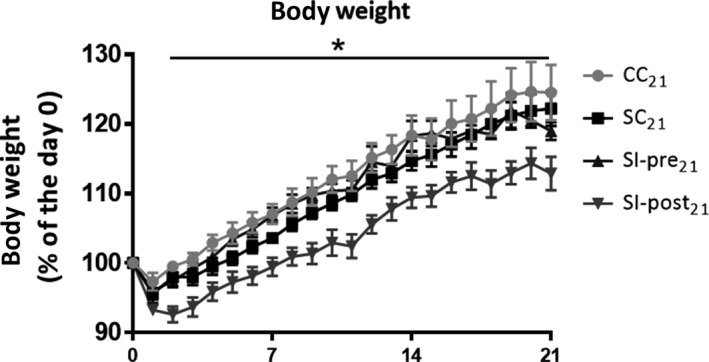
Figure 2.

Changes in body weight in animals sacrificed on day 21 after ischemia induction or sham‐surgery: body weight is displayed as percentage of the body weight on the day of ischemia induction or sham‐surgery (day 0). CC 21 = control group (n = 4), SC 21 = stroke + control diet (n = 5), SI‐post21 = stroke + postischemic dietary intervention (n = 5), SI‐pre21 = stroke + preischemic dietary intervention (n = 6). The body weight of the stroke group treated with the investigational diet after stroke induction (SI‐post21) was significantly lower than all the other groups (CC 21, SC 21, SI‐pre21) at all time points after stroke induction (day 1‐day 21). No significant differences between the CC 21, SC 21 and SI‐pre21 groups were observed. *P < 0.05 for SI‐post21, when compared to CC 21, SC 21, SI‐pre21 (GEE model)
