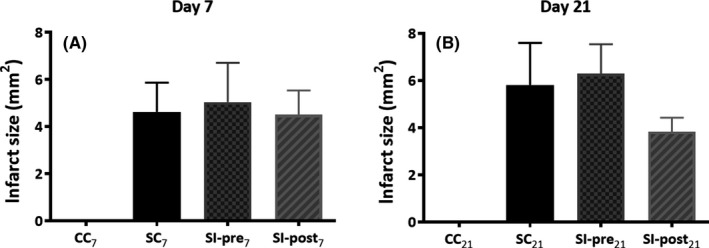
Figure 3.

Infarct size on day 7 A, and day 21 B, after focal ischemia induction. The infarct size was assessed on the isolated brains by measuring the length (alongside Bregma) and width (perpendicularly to Bregma) of the visible scar. Data are displayed as length*width in millimeters for animals sacrificed at day 7 A, and day 21 B, following ischemia. SC 7, SC 21 = stroke + control diet (n = 6, n = 5), SI‐post7, SI‐post21 = stroke + postischemic dietary intervention (n = 6, n = 5), SI‐pre7, SI‐pre21 = stroke + preischemic dietary intervention (n = 6, n = 6)
