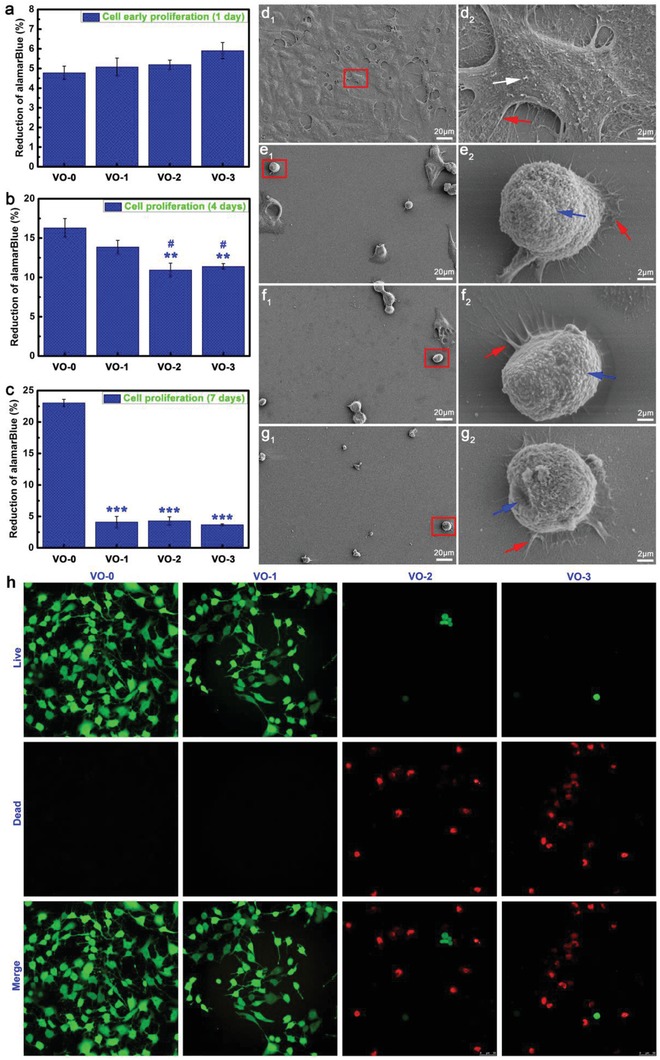
Figure 3.

Tumor cell viability results after a) 1 day, b) 4 days, and c) 7 days of culture on the samples VO‐0, VO‐1, VO‐2, and VO‐3 (Note: **P < 0.01, ***P < 0.001 versus VO‐0; # P < 0.05 versus VO‐1). Tumor cell morphology and cell–material interactions after 4 days of culture on the samples d1,d2) VO‐0, e1,e2) VO‐1, f1,f2) VO‐2, and g1,g2) VO‐3 (Note: white arrow, indicating the exuberant extracellular matrix mineralization; red arrow, indicating the abundant lamellipodia and filopodia extensions; blue arrow, indicating the deteriorating cell membrane). h) Live/dead fluorescence staining results of tumor cells after 4 days of culture on the samples VO‐0, VO‐1, VO‐2, and VO‐3.
