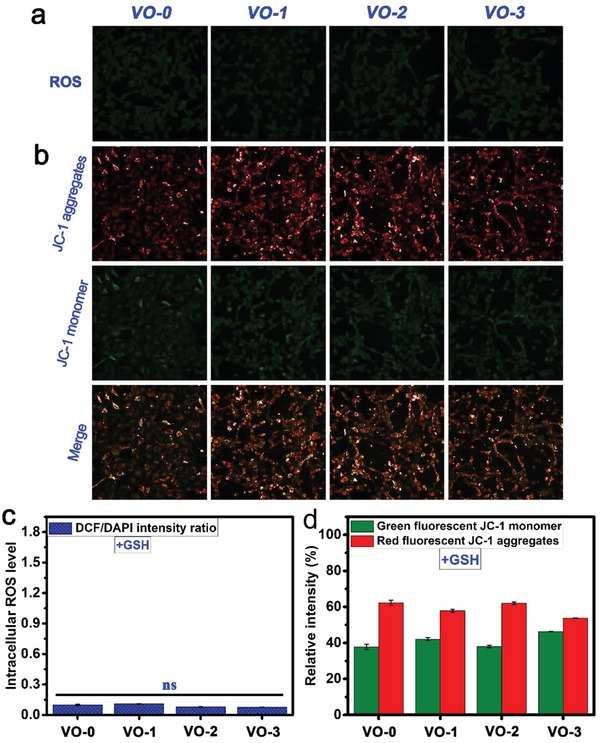
Figure 5.

Fluorescence staining images of a) intracellular ROS for tumor cells and b) mitochondria membrane potentials after 4 days of culture on the samples VO‐0, VO‐1, VO‐2, and VO‐3 with adding GSH, accompanied by the corresponding quantitative results of c) ROS levels and d) membrane potentials. Note: ns, not significant.
