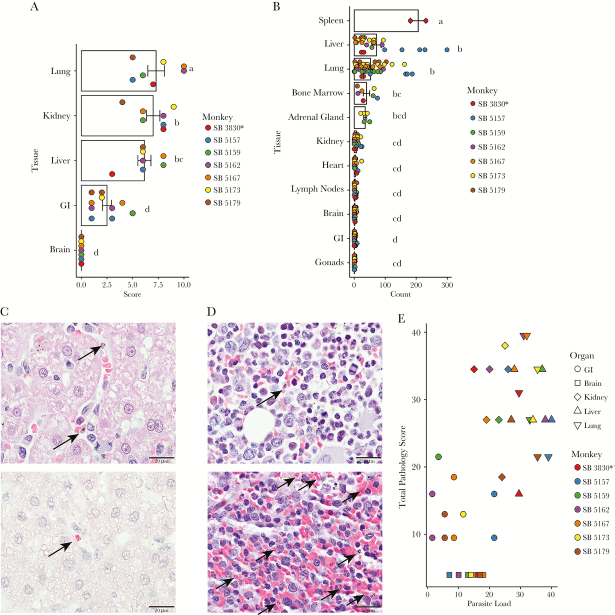
Figure 4.
Histopathological and parasitological tissue analysis, in the organs of 7-infected Saimiri boliviensis with asterisk indicating spleen-intact animal. (A) Histopathological tissue scores: the means, data points, and standard errors are reported, with the height of the bar showing the mean, the dots indicating individual data points, and the error bars showing the standard error of the mean. Statistical significance as determined by the Tukey honest significant difference test is indicated by letters above the bars. Each data point represents the whole organ score obtained from examination of hematoxylin and eosin (H&E)-stained tissue sections. (B) Quantification of parasite load in the organs. Three hundred nineteen sections were examined. Each data point represents the total number of parasites in 60 consecutive oil-immersion (×1000) fields in a single H&E-stained section. (C, top) Mature parasites are readily identifiable in H&E-stained sections (black arrows). Scale bar = 20 μm. (C, bottom) Select sections were stained with antiparasite lactate dehydrogenase antibody (fuschin red) and counterstained with hematoxylin as an alternative means to show and confirm parasite presence (black arrow). Scale bar = 20 μm. (D) Representative H&E-stained sections of bone marrow from a splenectomized animal (top), and the spleen from the intact animal (bottom) indicating the distribution of parasites (black arrows). (E) Histopathological score versus organ parasite load. Scatter plot of the rank of the sum of the parasite counts in 60 consecutive oil-immersion (×1000) fields in all sections of a given organ in a given monkey plotted against the rank of the total pathology score. Only tissues with scores were included.

