
Figure 2.
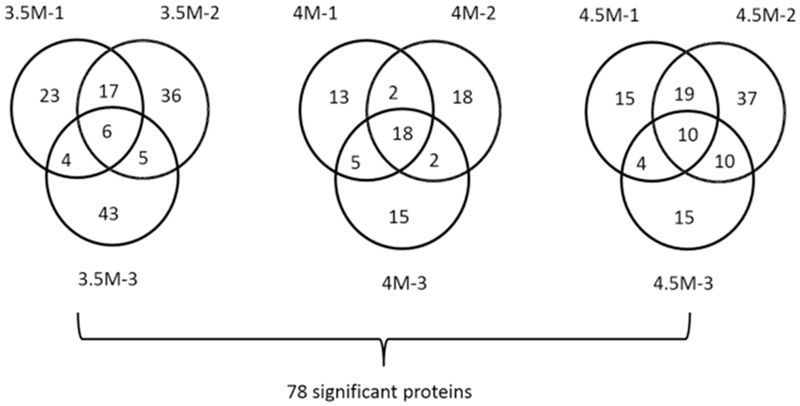
Number of proteins detected as NAD binding by the experiments. A total of three urea concentrations (3.5, 4.0, and 4.5 M) were used, and for each, three biological replicates were produced. We considered that NAD significantly changed the stability of a protein if the ratio of the protein measured by quantitative mass spectrometry with and without NAD changed 1.25-fold or more. Then, a protein is as NAD binding for a certain urea concentration if the protein ratio was 1.25 or higher in at least two out of the three replicates. The number of proteins with a significant protein ratio detected by each replicate is shown in the Venn diagram. For example, 3.5M-1 indicates the first replicate of a 3.5 M urea concentration. In total, 32, 27, and 43 proteins were detected as NAD binding at a 3.5, 4.0, and 4.5 M urea concentration, respectively, with 78 unique proteins in total.