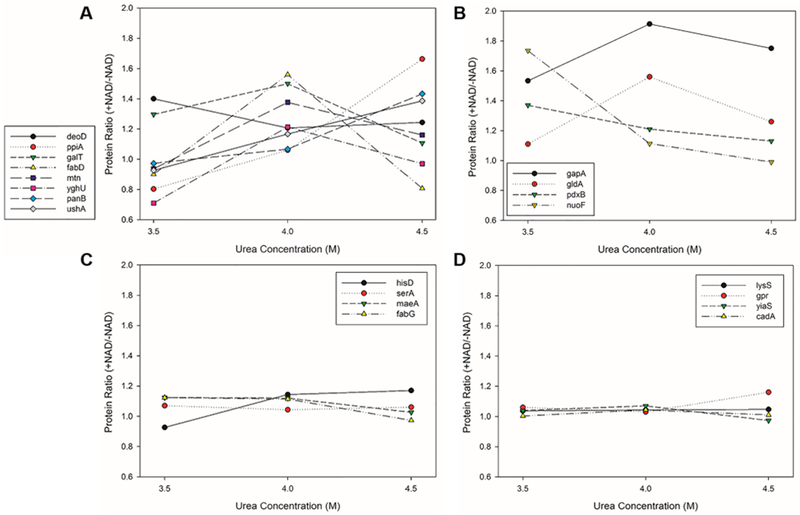
Figure 6.

Protein ratio profile under three urea concentrations for the predicted novel NAD-binding proteins and other representative proteins. (A) The eight predicted novel NAD-binding proteins. (B) Examples of known NAD-binding proteins that are detected as significant proteins by the pulse-proteolysis experiments. (C) Examples of known NAD-binding proteins that are not detected as significant proteins by the experiments. (D) Examples of proteins that are neither known as NAD-binding proteins nor detected as significant proteins by the experiments. Via the quantitative mass spectrometry analysis following pulse proteolysis, a protein is considered NAD-binding if its protein ratio with and without NAD is 1.25 or more for at least two out of three biological replicates. The protein ratio values plotted are the average of three biological replicates.
