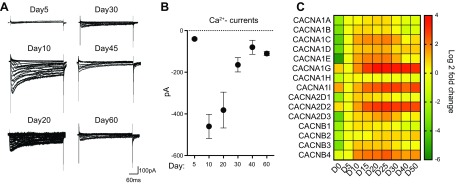
Figure 4.
Characterization of voltage-gated calcium channels in NEUROG2/1 iNs. A) Representative traces of whole-cell Ca2+ currents recorded in NEUROG2/ iNs at different time points during development. Current traces were elicited by depolarizing voltage steps from −80 to +20 mV for 200 ms at a holding potential of −100 mV. B) Quantification of Ca2+ currents. The Ca2+ currents were recorded on d 5 (n = 6), 10 (n = 5), 20 (n = 6), 30 (n = 7), 45 (n = 4), and 60 (n = 3). C) Heatmap of expression levels of genes encoding voltage-gated calcium channels in iNs during development. All expression levels are normalized to those on d 5 (D5).

