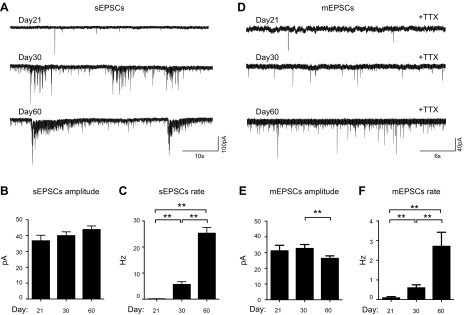
Figure 6.
Developmental changes in the excitatory synaptic transmission of iN networks. A) Representative traces of sEPSCs recorded from iNs on d 21, 30, and 60. B, C) Quantification of the amplitude (B) and frequency (C) of the sEPSCs during development. D) Representative traces of mEPSCs recorded from iN cells on d 21, 30, and 60 after induction. E, F) Quantification of the amplitude (E) and frequency (F) of the mEPSCs during development. The analyses of sEPSCs included recordings of 16, 27, and 27 iNs on d 21, 30, and 60, respectively; analyses of mEPSCs included recordings of 5, 12, and 22 iNs on d 21, 30, and 60, respectively. **P < 0.01 (unpaired Student’s t test).

