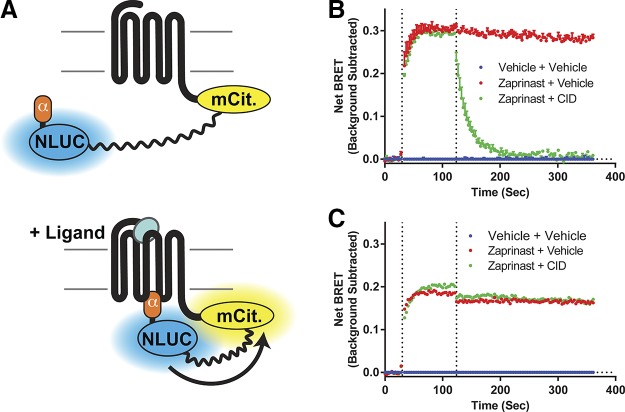
Figure 2.
Kinetics of activation and deactivation of GPR35-Gα sensors. A) A diagram illustrates the nature of the GPR35–G protein sensors used and why G protein engagement induced by binding of an agonist ligand to the receptor is anticipated to result in enhanced BRET signal as the Nanoluc (NLUC) and mCitrine (mCit) components move closer together. B, C) Flp-In T-REx 293 cells stably harboring hGPR35-Gα13 (B) or mGPR35-Gα13 (C) were treated with doxycycline to induce construct expression. Kinetic studies were then performed to assess changes in BRET signal over time. Zaprinast (red) (EC80 16 μM for human and 1 μM for mouse) or vehicle (blue) (HBSS with DMSO) were added at time 30 s (first vertical line) and maintained for a further 330 s. In certain studies, the human-specific GPR35 antagonist CID2745687 (CID) (green) (10 μM) was added at 120 s (second vertical line).

