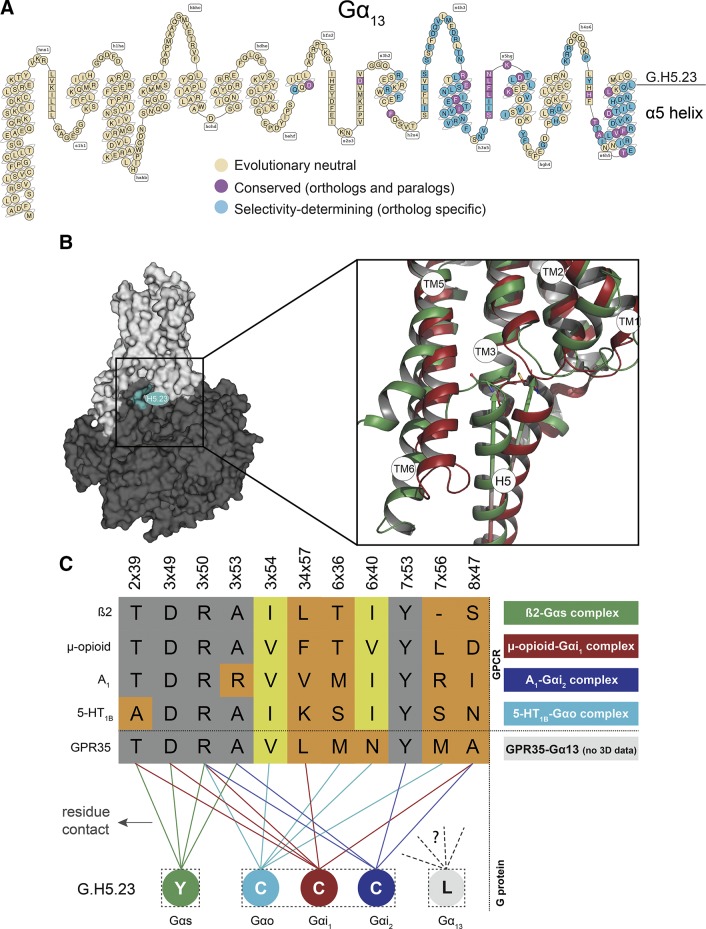
Figure 7.
Modeling studies. A) Snake-like diagram of Gα13 with the G protein barcode highlighting evolutionary neutral, conserved, and selectivity-determining positions (barcode cutoff 0.96). B) Location of G.H5.23 (cyan) in the receptor-G protein complex (left) and comparison of the α5 helix domain C termini of Gαs (green) and Gαi1 (red) (right). Arrows indicate the rotation differences between the α5 helix domains. Comparison of interface contacts and contacting residues between recently published GPCR–G protein structures are shown, as well as for the GPR35 G12/G13 selectivity-determining position G.H5.23. C) Alignment of G.H5.23 contacting receptor residue positions (gray: conserved; yellow: differing). This suggests a structurally yet-to-be-defined, alternative binding mode and contact profile for the G12/G13 family subtypes and their receptor coupling partners.

