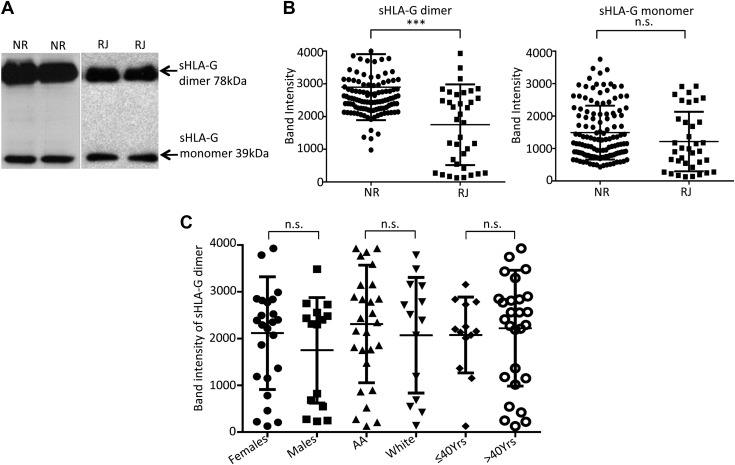
Figure 1.
sHLA-G dimer levels are higher in NR than RJ kidney transplant patients and are not affected by demographic status. A) Representative immunoblot showing sHLA-G monomer and sHLA-G dimer levels from plasma of KTRs (n = 40/group). Each lane represents 1 patient. B) Dot plots show pooled data as mean band densities of sHLA-G dimer and sHLA-G monomer in NR and RJ kidney transplant patients. Data presented as means ± sd. N.s., not significant. ***P < 0.001. C) Data represent the level of sHLA-G dimer among the various demographic categories of KTRs. AA, African American; n.s., not significant.

