Figure 2.
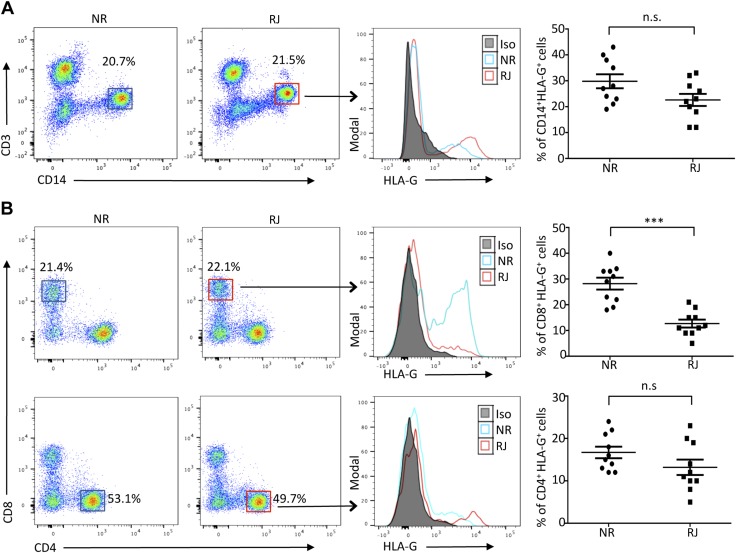
Increased expression of HLA-G on CD8+ T cells of NR patients. A) Representative flow cytometry plots from NR and RJ kidney transplant patients (n = 10/group), showing the gating strategy used to determine HLA-G expression on CD14+ CD3− cells (monocytes). Histogram depicts HLA-G expression in RJ KTRs (red lines) and NR patients (blue lines). Filled histogram represents isotype control (Iso). Graphical summary shows the frequency (%) of HLA-G–expressing monocytes within each group. B) Representative flow cytometry dot plots from NR and RJ transplant patients (n = 10/group) gated on CD8+ and CD4+ populations of T cells. Histograms depict HLA-G expression of the NR (blue line) and RJ (red line) groups. Graphical summary shows the frequency (%) of HLA-G–expressing CD4 and CD8+ T cells within each group. Representative of at least 2 separate experiments (A, B). N.s., not significant. Data are shown as means ± sd. ***P < 0.001.

