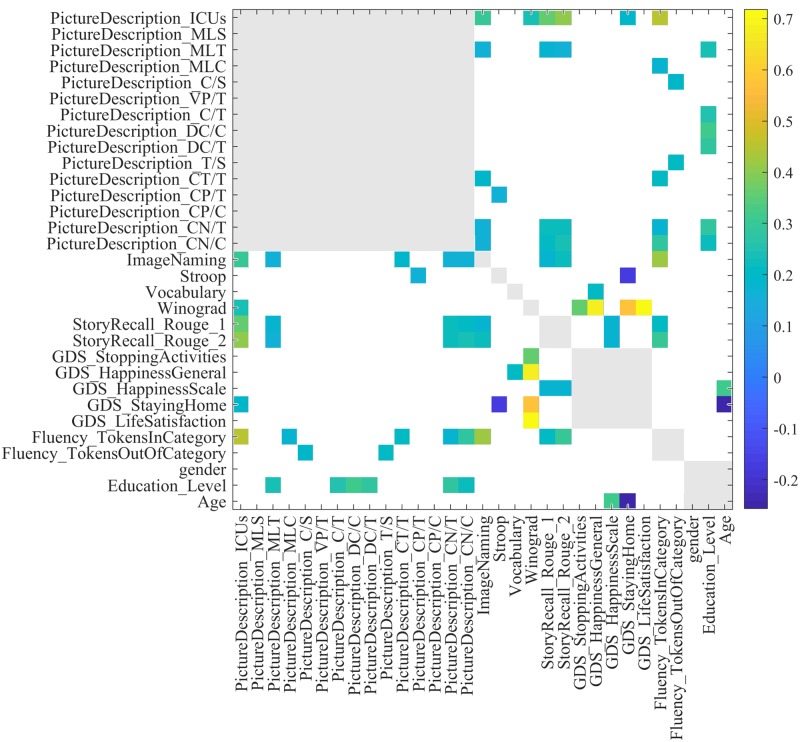
Fig 11. Correlation between scores of different tasks. For a better visualization, same-task correlation values are shown in gray and those that are not significant with respect to p = 0.05 are in white.
S: # of sentences, T: # of T-units, C: # of clauses, VP: # of verb phrases, CT: # of complex T-units, CN: # of complex nominals, CP: # of coordinate phrases, DC: # of dependent clauses, MLS: Mean length of sentence, MLTU: Mean length of T-unit, MLC: Mean length of clause.

