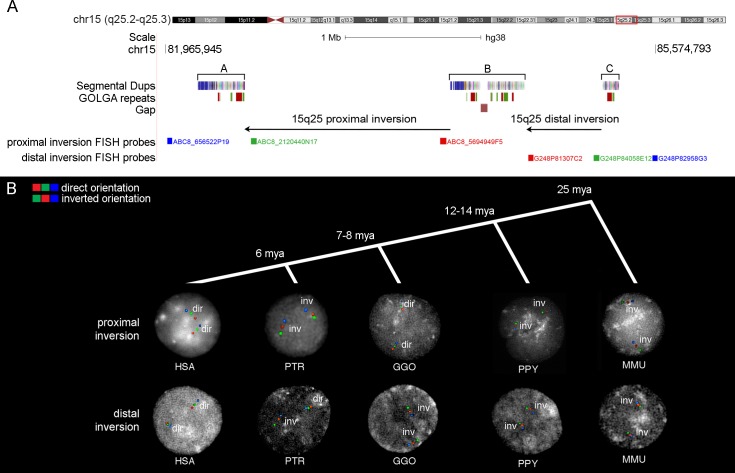
Fig 1. Experimental validation of genomic inversions at 15q25.
(A) UCSC Genome Browser view of the 15q25 region. Segmental duplication blocks A, B and C are shown with colored boxes. GOLGA repeat locations from blat analyses of GOLGA2P10 and GOLGA6L5P are depicted with green and red boxes mapping on the plus or minus strand, respectively. Proximal and distal tested inversions are shown with black arrows and fosmid clones used for FISH experiments on interphase nuclei are indicated with colored blocks followed by the fosmid names. Segmental duplication colors show the ancestral origins of duplications based on comparison with mammalian groups assigned by DupMasker [76]. (B) FISH results on interphase nuclei for proximal and distal inversions in each analyzed species. The color order indicates probes relative orientation, with red-green-blue signals showing haplotypes in direct orientation and green-red-blue signals showing inverted haplotypes. FISH analyses of the proximal inversion show that macaque, orangutan, and chimpanzee are all inverted when compared to the human reference genome orientation, while all gorillas are in direct orientation. The distal inversion is polymorphic within the chimpanzee population, while all the other species are inverted in the homozygous state when compared to human. Timing of species divergences is also shown at the top (mya = million years ago). HSA = Homo sapiens; PTR = Pan troglodytes; GGO = Gorilla gorilla; PPY = Pongo pygmaeus; MMU = Macaca mulatta.

