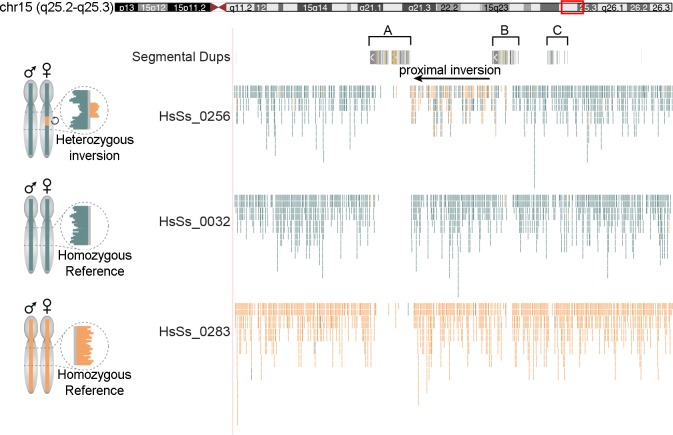
Fig 2. Strand-seq of the proximal inversion at 15q25.
On the left, ideograms of expected Strand-seq results for each possible inversion genotype are shown. On the right, a UCSC Genome Browser view (coordinates lifted to GRCh37/hg19) of Strand-seq data, BED-formatted and uploaded as custom tracks, of the three libraries is shown. For each cell, aligned reads are indicated as individual lines in Crick (teal) or Watson (orange) state. In the library on the top (HsSs_0256) mixed Watson and Crick reads at the proximal inversion (black arrow) indicate the heterozygosity of the region while in the others a direct orientation of the region is shown.

