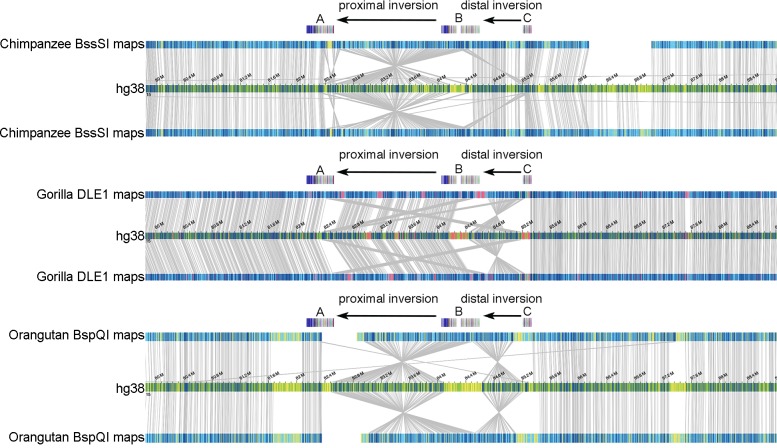
Fig 3. Bionano analysis of the 15q25 region.
Bionano optical mapping data of three great ape genomes at the 15q25 locus. The two black arrows in each plot denote the two loci where inversions are observed between the apes and human. Segmental duplication blocks A, B and C are also shown with colored boxes. In each display, the top and bottom maps represent the two alleles of the de novo assembled genomes for each species with respect to the human reference assembly (hg38 track). The individual labels represent the positions of the label motifs of the enzyme used. The top panel shows the alignments of the assembled Nt.BssSI genome maps of a chimpanzee sample. The blue labels are the aligned labels, whereas the yellow ones are unaligned labels. The middle panel shows gorilla maps generated by DLE-1 enzyme, and the blue and red labels represent aligned and unaligned labels, respectively. Finally, the bottom panel illustrates how an orangutan genome—constructed using Nb.BspQI—is aligned to human, with blue representing aligned labels and yellow the unaligned ones.

