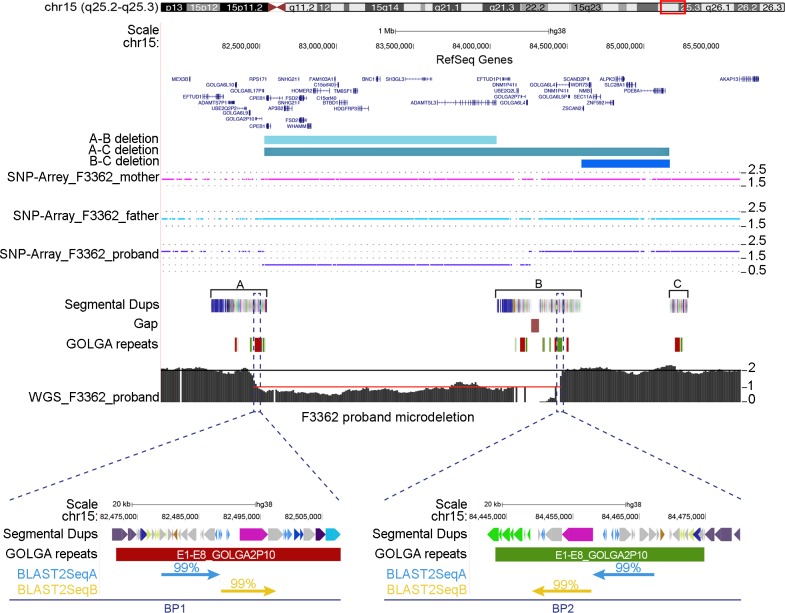
Fig 4. Deletions at the 15q25 region.
Three different classes of microdeletions with breakpoints between segmental duplication blocks A-B, A-C and B-C are shown as colored boxes. Segmental duplications are shown with colored boxes. GOLGA repeat locations from the blat analysis of GOLGA2P10 and GOLGA6L5P are depicted with green and red boxes mapping on plus or minus strand, respectively. SNP array and whole-genome sequencing (WGS) data of a patient with a 15q25 A-B deletion are shown. The SNP array highlights a copy number (CN) of 2 for the parents while the proband shows a CN of 1 for the deleted region. WGS shows a CN of 2 for the regions flanking the microdeletion (black line) and a CN of 1 (red line) for the deleted region. At the bottom of the figure are shown the results of a blast2Seq alignment between the two microdeletion breakpoint intervals. The two largest alignments of 9.4 kbp (blast2SeqA) and 9 kbp (blast2SeqB) with 99% similarity are shown with light blue and yellow arrows, respectively. GOLGA2P10 repeats, which encompass the regions of high similarity at the breakpoints, are also shown in the zoom inset.

