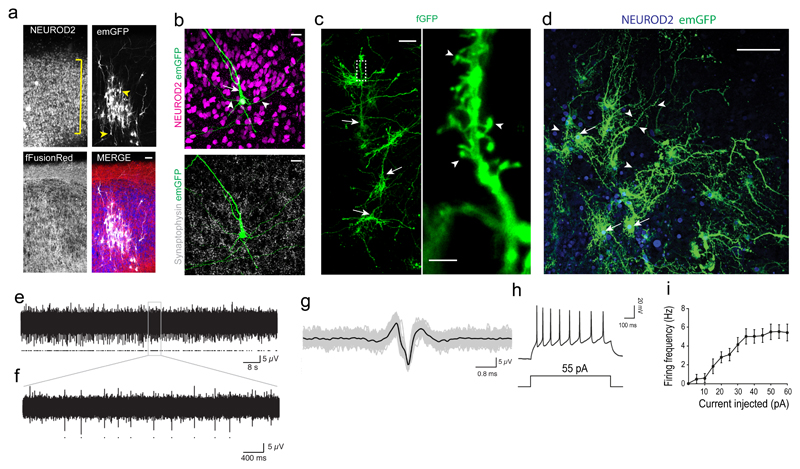
Figure 2. ALI-CO cultures exhibit mature neuronal morphology and function.
a. Sparse labeling in an ALI-CO at 37 days at the ALI (80 days total) by Sendai-virus encoding emGFP (white) reveals radially aligned neurons (NEUROD2, blue) with complex dendritic architectures and pyramidal morphologies (arrowheads) within the aligned cortical plate (bracket). All cells contain fFusionRed (red) to visualize the overall tissue morphology. b. Higher magnification of a maximum intensity projection of a single emGFP (green) labeled neuron (NEUROD2+, magenta) displaying typical pyramidal morphology with primary dendrite (arrow) and basal dendrites (arrowheads). Synaptophysin (white) reveals extensive synaptic staining throughout. c. Electroporation of membrane targeted farnesylated GFP (fGFP, green) reveals complex dendritic architecture of radially aligned pyramidal neurons (arrows) in a maximum intensity projection with evident dendritic spines (arrowheads, inset) in an ALI-CO at 51 days at the ALI (143 days total) d. Sparse labeling of a 1-year ALI-CO (90 + 275 days ALI) with Sendai-emGFP labels several individual neurons (arrows) with highly complex dendritic architectures and abundant dendritic spines (arrowheads). Sparse labeling with emGFP and fGFP in a-d were performed on three ALI-COs from three organoids with similar results. e. Two minutes of spontaneous activity recorded from a single electrode of a multi-electrode array (MEA) in an ALI-CO at 54 days at the ALI (117 days total); detected action potentials marked with dots. f. Five-seconds from the same recording (expanded from grey box). g. Overlay of all detected spikes (grey, marked by dots in f) with mean waveform in black. h. Whole-cell patch clamp recordings of action potentials evoked by a 55pA current injection. i. Frequency-current (F-I) curve showing average action potential firing rate with increasing amplitude of current injection (error bars are S.E.M., n=13 cells from 7 ALI-COs of 3 independent organoid batches). Scale bars: 50 μm in a, c; 20 μm in b, 5 μm in c inset, 100 μm in d.

