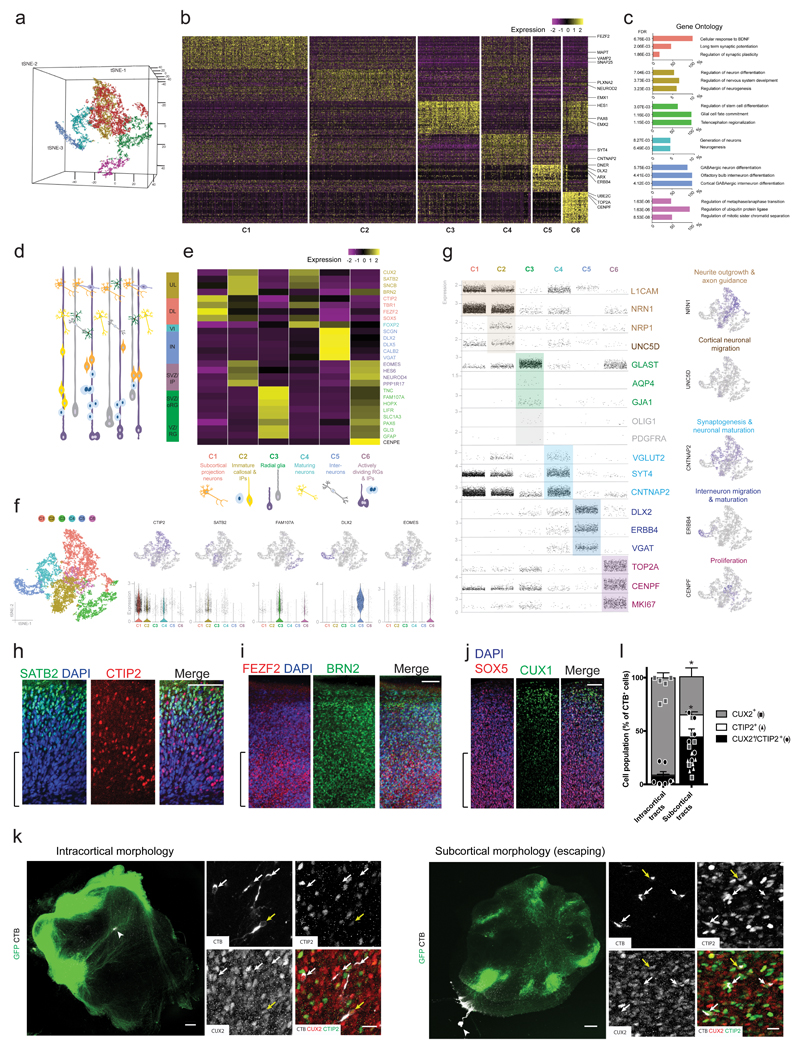
Figure 5. ALI-COs contain diverse neuron identities that exhibit specific projection patterns.
a. Unbiased tSNE separation of clusters based on single-cell RNA-sequencing data of 13,280 cells from 6 ALI-COs of 3 organoids (sample and data acquisition detailed in methods) visualized on a 3D space, showing six main populations. b. Heatmap demonstrating scaled levels of the top 50 differentially expressed genes in the main clusters (C1-6) with example genes (shown at right). c. Histograms of the three top gene ontology (GO) biological process annotations that were defined on the basis of the highest fold-enrichment amongst the most significant terms (Fisher’s exact test with FDR multiple test correction above 0.1% by http://geneontology.org, p < 0.001, n = 50 top differentially expressed genes per cluster).). Colour coding of bars represent cluster identities. d. Schematic representation of cells residing in the different layers of the fetal human cortex: ventricular zone (VZ) containing radial glia (RG), subventricular zone (SVZ) containing outer/basal radial glia (oRG) and intermediate progenitors (IP), deep (DL) and upper cortical plate layers (UL) as well as interneurons (IN) and layer 6 neurons (VI). e. Heatmap showing the scaled mean expression levels of layer- and cell-type specific genes within the six unbiased clusters, identifying the major cell populations. The colour coding of layers, marker genes (right side) and cell types (bottom) corresponds with cluster identities (C1-C6, bottom). f. 2D tSNE plots of clusters (left side) and the distribution of cells expressing layer or cell-type marker genes across the main populations (upper row). Scatter plots below show the distribution of corresponding normalized gene expression values per cell within each cluster, and the violin plot is displayed where the proportion of cells expressing a given gene is the highest. Tails of the plot have been trimmed to represent the maxima and minima values of expression levels. The central hinge represents the median value for each cluster. The distribution in each cluster is based on the filtered and merged datasets deriving from the six organoid slice samples (n = 4191 cells for C1, 3565 cells for C2, 2068 cells for C3, 1658 cells for C4, 952 cells for C5, 846 cells for C6). g. Scatter plots demonstrating the normalized gene expression levels of genes per cell across the six main clusters with a focus on relevant neuronal, progenitor and glial functions. Feature plots (right hand column) demonstrate example genes expressed by populations confined to a particular cluster or by multiple cell populations. Colour coding represents functional gene associations. h. Staining for SATB2 reveals the presence of this upper layer marker and its distribution in a more superficial region, compared with CTIP2. Age: 20 days at the ALI, 90 days total. i. FEZF2+ deep-layer cells and BRN2+ superficial-layer cells are also present and exhibit appropriate distributions in an ALI-CO generated from another organoid. Age: 20 days at the ALI, 90 days total. j. Superficial CUX1+ cells are present in more superficial regions with SOX5+ cells in deeper locations. Age: 20 days at the ALI, 84 days total. Brackets in h-j denote the deeper regions of the ALI-CO cortical plate. h-j are representative images of a region of a single ALI-CO stained for each. k. Representative images of samples used for retrograde labeling by CTB microinjection (arrowheads indicate injection site) and quantification in l. reveals disparate identities contributing to distinct tract morphologies. Inset images are maximum intensity projections of Z-stacks used for quantifications. Individual channels and merge are shown. Yellow arrows indicate CTIP2+/CUX2+ cells and white arrows indicate CUX2 single positive (intracortical morphology, left) or CTIP2 single positive (subcortical escaping morphology, right) cells. l. Quantification of CTB+ cells indicate that tracts with internal projection morphology (left) traced back primarily to CUX2+ callosal projection identity cells while escaping subcortical morphology tracts traced back primarily to CTIP2+ identity cells, as well as CTIP2/CUX2 double positive cells. Six ALI-COs for each condition (intracortical and escaping) from four different organoids were labeled and all CTB-labeled cells across the entire depth of antibody penetration in whole ALI-CO slices were counted for CUX2 or CTIP2 staining. Statistics were performed only on comparisons of single positive cells because double-positive cells are of indeterminate identity. **P=0.0022 Two-tailed Mann-Whitney test, n = 6, error bars are S.E.M. Age: 33 days at the ALI, 97 days total. Scale bars: 100 μm in h, I, j; 300 μm in k, 20 μm in k inset.

