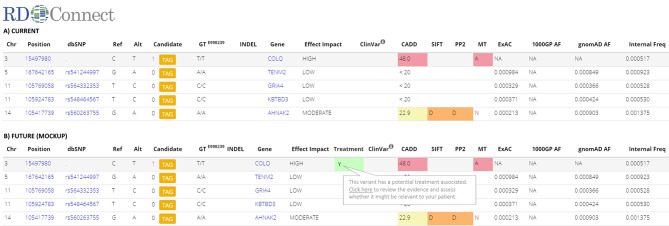
Figure 3. Mock-up of integration of treatabolome into the analysis system.
(A) A section of the current analysis results interface in the RD-Connect Genome-Phenome Analysis Platform, which includes a range of variant-level information that helps the user to assess which of the candidate variants is most likely causative. (B) The way it would be possible to incorporate an additional column into the results interface to show the clinical end-user that one of the variants they are assessing has a potential treatment associated, enabling them to evaluate the evidence base to decide whether it is appropriate for the patient in question.

