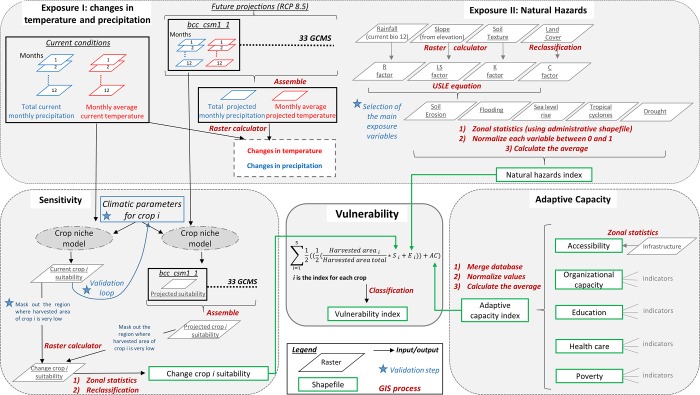
Fig 1. A Framework to assess the vulnerability of agriculture and rural livelihoods to projected climate change.
Source: Adapted from Marshal et al (2010) [27]. The framework is divided into four main grey boxes in which the outputs are combined into the final vulnerability index. Black arrows indicate the direction from input to output for the GIS process labelled in red. Rectangular green boxes indicate the output of the GIS process, which are formatted into shapefile datasets. Raster spatial data are displayed by grey parallelograms except for the climatic rasters where blue and red colours refer respectively to current and future conditions. Finally, blue stars refer to the requirement for expert validation or input from the scientific literature.

