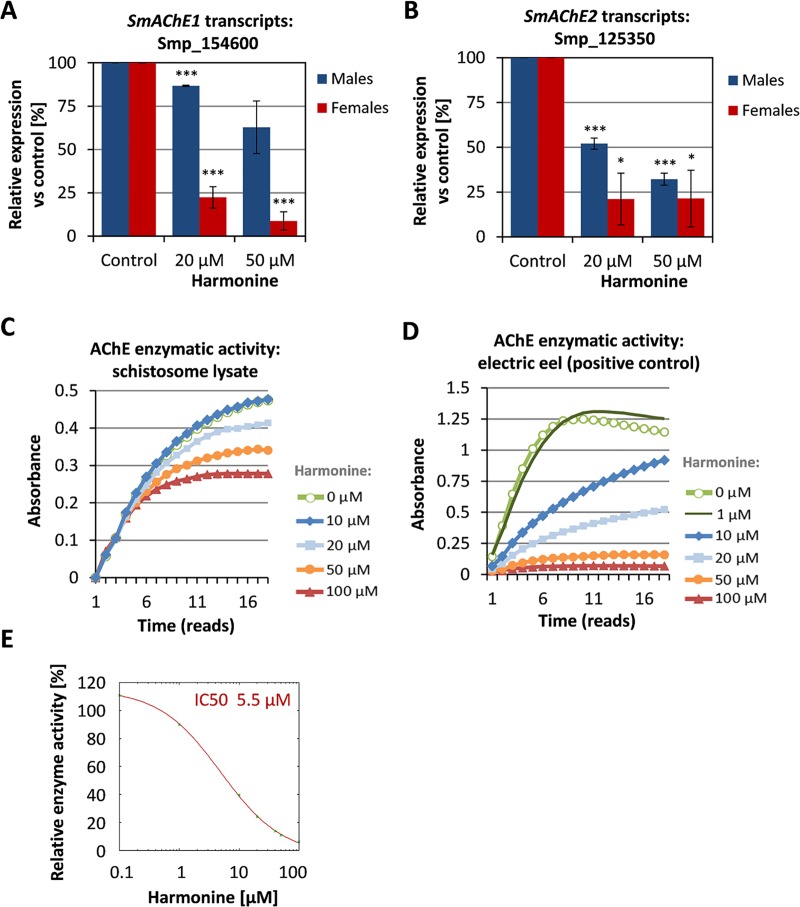
Fig 4. Inhibition of AChE enzymatic activity by harmonine.
(A, B) Expression of SmAChE1 (Smp_154600) and SmAChE2 (Smp_125350) in male and female schistosomes after 72 h treatment with different concentrations of harmonine as determined by qPCR, expressed as relative expression vs. the geometric mean of three reference genes. The expression in control worms was set to 100%. A summary of two experiments with SEM is shown. (C) Enzymatic activity over time in protein lysates of paired males after adding different concentrations of harmonine (0 – 100 μM). One representative out of three similar experiments is shown. (D) Enzymatic activity of AChE from a model organism (electric eel) after addition of different concentrations of harmonine (0 – 100 μM). One representative out of two similar experiments is shown. (E) Relative AChE activity of electric eel at 30 min after adding different concentrations of harmonine, with the activity at 0 μM set as 100%. Mean values of two experiments were used. IC50 was calculated by non-linear least squares curve fitting using the ic50.tk tool. Significant differences as determined by the unpaired t-test are indicated with * p<0.05 or *** p<0.001.

