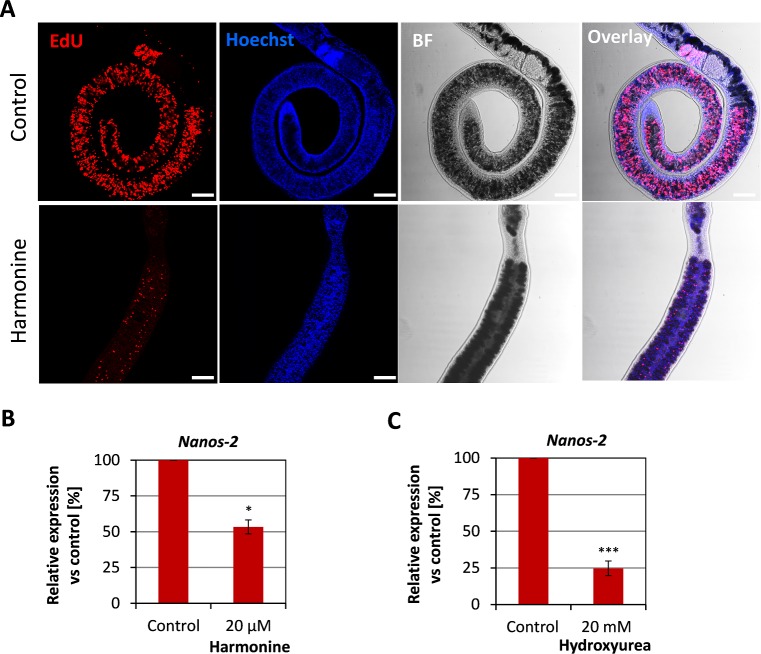
Fig 9. Reduction in the number of proliferating neoblasts upon harmonine treatment.
S. mansoni couples were treated and processed for EdU labeling of proliferating cells as described in Fig 7. (A) Representative images of a control and a harmonine-treated female showing proliferating cells (neoblasts) in the parenchyma and/or vitellarium. Scale bar: 100 μm. BF, bright field. (B, C) Expression of the stem cell marker nanos-2 (Smp_051920) in harmonine-treated (B) or hydroxyurea-treated (C) females related to the expression in untreated control females (set to 100%) as determined by qPCR (summary of two experiments). An unpaired t-test was performed to reveal significant differences (* p<0.05, *** p<0.001).

