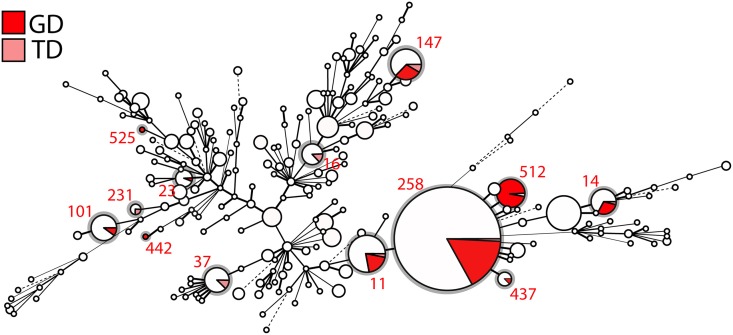
Fig 6. Minimum spanning tree of 1,557 K. pneumoniae strains based on their MLST profile.
Each circle corresponds to a distinct ST, with its size being proportional to the number of strains of that particular ST (for scale, ST258 contains 552 isolates). Within an ST, the proportion of strains harbouring either a GD or TD insertion in the loop L3 of ompK36 is shown as a sector coloured in red and pink, respectively. STs carrying these mutations are also circled in grey.

