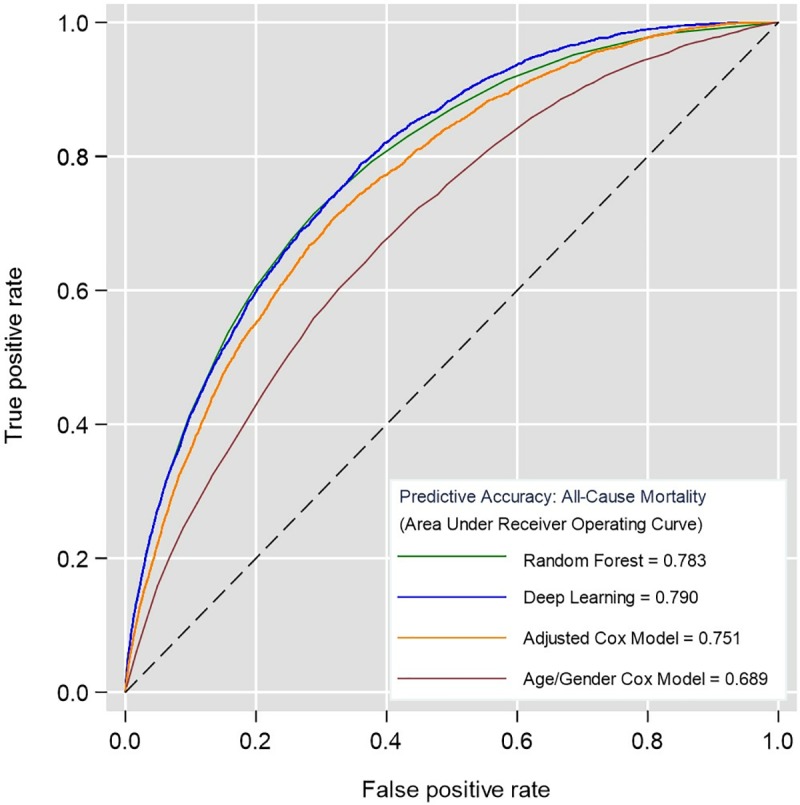
Fig 3. Receiver operating curves derived from predicting all-cause mortality in the test cohort (n = 125,657) using Cox models, random forest and deep learning.

Higher area under the curve (c-statistic) shows better discrimination.

Higher area under the curve (c-statistic) shows better discrimination.