
Fig. 2.
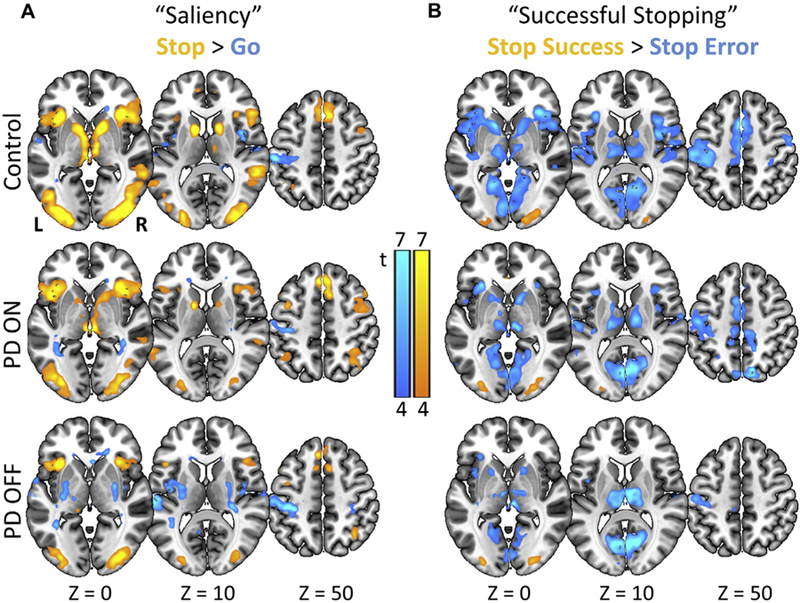
Functional magnetic resonance imaging results: 1-sample t-tests showing SST activations for each group. (A) Activations to “saliency” or all stop > go trials (i.e., infrequent stimuli compared to frequent stimuli). (B) Activations to “successful stopping” or stop success > stop error trials. Maps are thresholded at 4 > t > 7 (where brighter colors indicate higher values), for visualization. (For interpretation of the references to color in this figure legend, the reader is referred to the Web version of this article.)